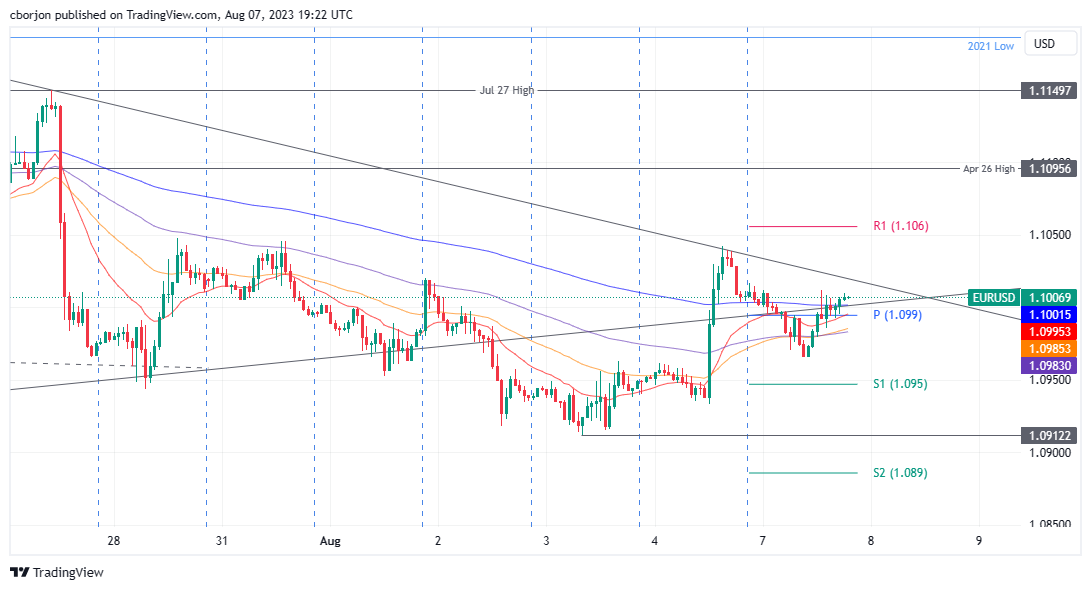
- EUR/USD remains below the key 1.1000/1.1018 resistance area, hindered by the 20-day EMA and a one-month-old resistance trendline.
- The currency pair is trading at 1.1007, showing a slight decrease of 0.01% ahead of the Wall Street closing bell.
- Despite the emergence of a ‘morning-star’ three-candlestick chart pattern suggesting upward momentum, Monday’s doji formation signals hesitancy among buyers.
- Key resistance lies at 1.1020, with potential for movement towards 1.1055 and 1.1095, while support can be found at 1.0947 and 1.0933.
The EUR/USD erases some of its earlier losses but remains capped by the 20-day Exponential Moving Average (EMA) intersection with a resistance trendline at around the 1.1000/1.1018 area. The EUR/USD exchanges hands at 1.1007, down 0.01% ahead of the Wall Street close.
EUR/USD Price Analysis: Technical outlook
From a daily chart perspective, the EUR/USD should be headed upward as a ‘morning-star’ three-candlestick chart pattern emerges. But Monday’s price action forming a doji indicates buyers are struggling to gather momentum, which could lose control to sellers if the EUR/USD falls below 1.1000.
From a short-term standpoint, the EUR/USD is tilted upward, but a one-month-old resistance trendline would be difficult to surpass as the pair edges higher. A breach of 1.1020 will put into play the R1 daily pivot at 1.1055, followed by the April 26 high at 1.1095 ahead of 1.1100.
On the other hand, if EUR/USD tumbles below 1.1000, the following support would be the S1 pivot point at 1.0947, followed by last Friday’s low of 1.0933. Failure to crack the latter could spark an upward correction, as the EUR/USD could fail to achieve a new lower low. A continuation could pave the way to challenge 1.0900.
EUR/USD Price Action - Hourly chart
Information on these pages contains forward-looking statements that involve risks and uncertainties. Markets and instruments profiled on this page are for informational purposes only and should not in any way come across as a recommendation to buy or sell in these assets. You should do your own thorough research before making any investment decisions. FXStreet does not in any way guarantee that this information is free from mistakes, errors, or material misstatements. It also does not guarantee that this information is of a timely nature. Investing in Open Markets involves a great deal of risk, including the loss of all or a portion of your investment, as well as emotional distress. All risks, losses and costs associated with investing, including total loss of principal, are your responsibility. The views and opinions expressed in this article are those of the authors and do not necessarily reflect the official policy or position of FXStreet nor its advertisers. The author will not be held responsible for information that is found at the end of links posted on this page.
If not otherwise explicitly mentioned in the body of the article, at the time of writing, the author has no position in any stock mentioned in this article and no business relationship with any company mentioned. The author has not received compensation for writing this article, other than from FXStreet.
FXStreet and the author do not provide personalized recommendations. The author makes no representations as to the accuracy, completeness, or suitability of this information. FXStreet and the author will not be liable for any errors, omissions or any losses, injuries or damages arising from this information and its display or use. Errors and omissions excepted.
The author and FXStreet are not registered investment advisors and nothing in this article is intended to be investment advice.
Recommended content
Editors’ Picks
EUR/USD clings to gains above 1.0850 after US inflation data

EUR/USD trades in positive territory above 1.0850 in the American session on Friday. The US Dollar struggles to preserve its strength following the April PCE inflation data and helps the pair hold its ground heading into the weekend.
GBP/USD retreats from 1.2765, holds on to modest gains

GBP/USD posted a two-day high peat at 1.2765 in the American session, as US data showed that the core PCE inflation held steady at 2.8% on a yearly basis in April. The pair retreated afterwards as risk aversion triggered US Dollar demand.
Gold falls towards $2,330 as the mood sours

US inflation-related data took its toll on financial markets. Wall Street turned south after the opening and without signs of easing price pressures in the world’s largest economy. The US Dollar takes the lead in a risk-averse environment.
Here’s why Chainlink price could crash 15% despite spike in social volume Premium

Chainlink price has flashed multiple sell signals after its recent climb, hinting at a short-term correction. This signal comes despite a double-digit growth in its social volume. LINK bulls need to exercise caution as this forecast is backed by on-chain metrics.
Week ahead – ECB rate cut might get eclipsed by BoC surprise and NFP report

ECB set to slash rates on Thursday, focus on forward guidance. But will the BoC take the lead when it meets on Wednesday? US jobs report eyed on Friday as Fed unyielding on cuts. OPEC+ might extend some output reductions into 2025.