
Advertisement
Advertisement
USD/JPY Bears Target Sub-138 on Bank of Japan YCC Policy Tweak
By:
It is a busy day for the USD/JPY. Tokyo inflation numbers will influence ahead of the all-important BoJ monetary policy decision. US stats will also draw interest.

In this article:
Highlights
- It is a big day ahead for the USD/JPY, with inflation numbers from Japan in focus ahead of the heavily anticipated Bank of Japan monetary policy decision.
- While we can expect plenty of price action in the morning, the US economic calendar needs consideration, with inflation numbers out.
- The near-term technical indicators turned bearish, signaling a return to sub-138.
On Thursday, the USD/JPY fell by 0.58% to wrap up the day at 139.428. US GDP numbers for Q2 delivered support before reports of the BoJ planning to tweak its Yield Curve Control Policy sent the USD/JPY into negative territory.
This morning, Tokyo inflation numbers for July will set the tone ahead of the Bank of Japan monetary policy decision. A hotter-than-expected CPI report would support bets on a BoJ tweak from ultra-loose. Economists forecast the Tokyo annual core inflation rate to soften from 3.2% to 2.9%.
While the numbers will move the dial, the Bank of Japan monetary policy meeting and press conference will have more impact. A tweak to the Yield Curve Control (YCC) Policy would weigh on the USD/JPY.
Overnight, reports of the Bank of Japan planning to allow longer-term interest rates to rise above the 0.5% cap for 10-year government bonds sent the USD/JPY into reverse.
The markets expect the Bank of Japan to begin moving away from its ultra-loose monetary policy stance. Initially, the Yield Curve Control Policy will be the likely focal point. A shift away from ultra-loose and an end to the Fed monetary policy tightening cycle would tip the scales in favor of the Yen.
The US Session
US Core PCE Price Index and personal spending numbers will be the stats to track. Fed Chair Powell left the door ajar for a September rate hike. A hotter-than-expected core PCE price index and personal spending would support a more hawkish Fed policy outlook.
The Core PCE Price Index is the Fed’s preferred inflation indicator. Sub-4% would likely shut the door on the Fed hawks. However, personal spending needs consideration, with a pickup in spending likely to drive consumer price inflation through demand.
USD/JPY Price Action
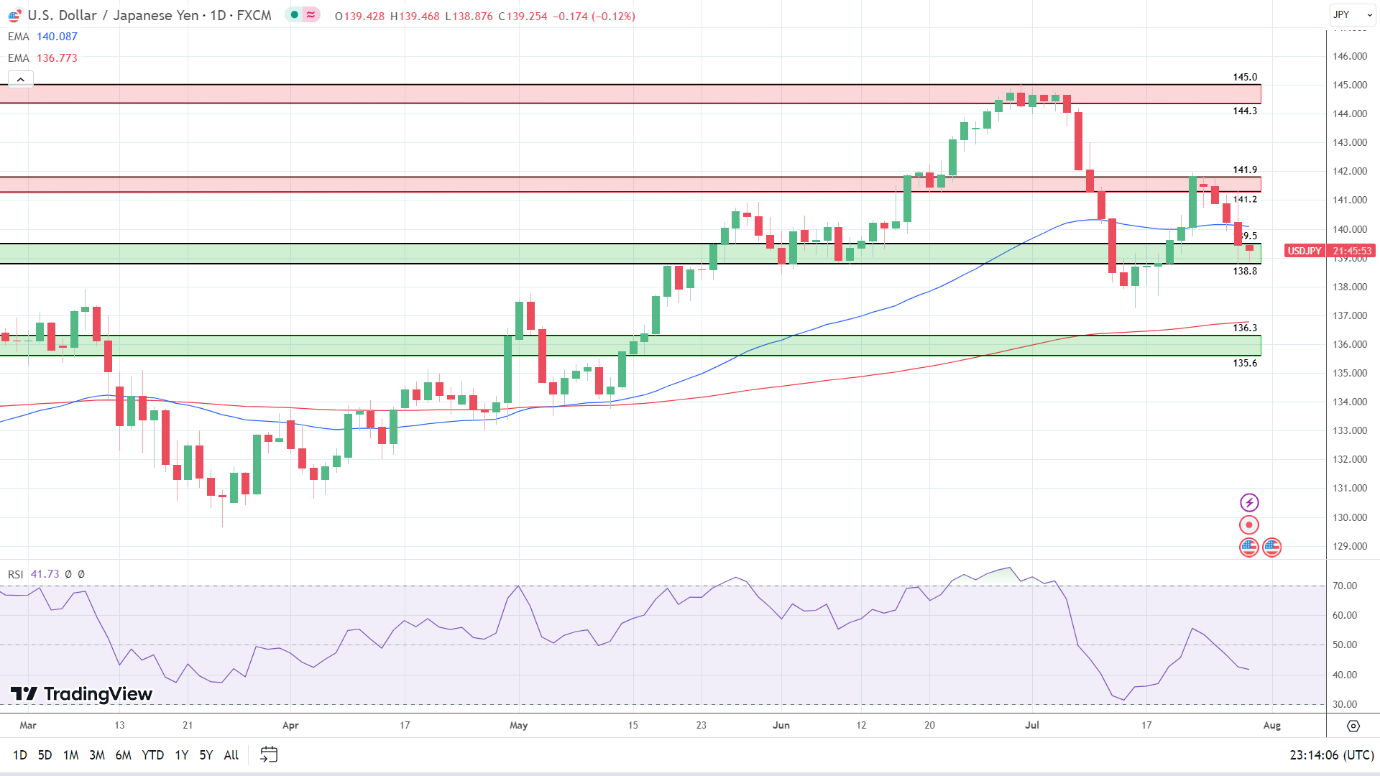
Daily Chart
The Daily Chart showed the USD/JPY hovered at the upper level of the 139.5 – 138.8 support band. A fourth day in the red sent the USD/JPY through the 50-day EMA (140.087). However, the USD/JPY remained above the 200-day EMA (136.773), sending bearish near-term but bullish longer-term price signals.
Notably, the 50-day EMA narrowed on the 200-day EMA, supporting further losses.
Looking at the 14-Daily RSI, the 41.73 reading signals a bearish outlook, supporting a fall through the 139.5 – 138.8 support band to target sub-138. However, a USD/JPY move through the 50-day EMA (140.087) would give the bulls a run at the 141.2 – 141.9 resistance band.
Price action today is hinged on Tokyo inflation numbers and the Bank of Japan monetary policy decision and press conference.
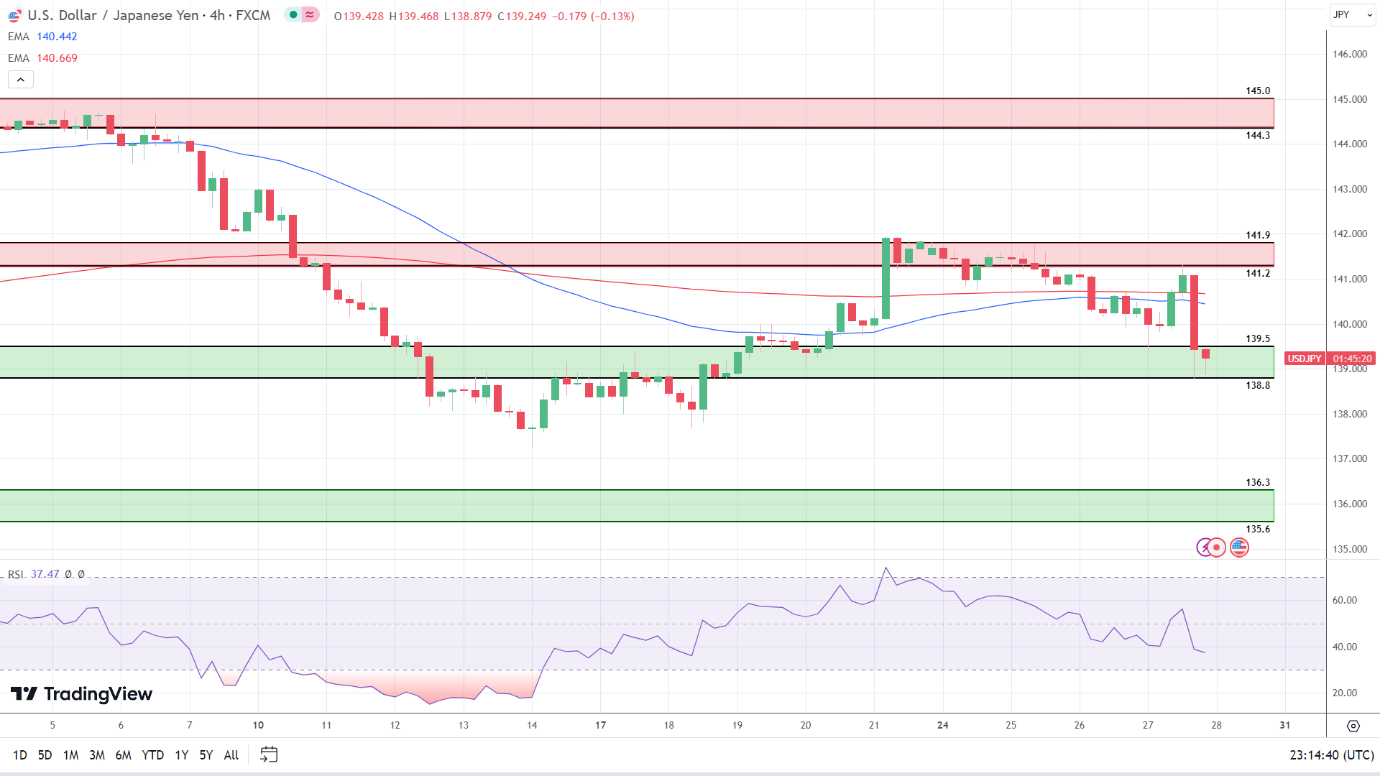
4-Hourly Chart
Looking at the 4-Hourly Chart, the USD/JPY faces strong resistance at 140. However, the USD/JPY sits below the 200-day (140.669) and 50-day (140.442) EMAs, sending bearish near and longer-term price signals.
Significantly, the 50-day EMA pulled back from the 200-day EMA, signaling a fall through the 139.5 – 138.8 support band. However, a USD/JPY move through the EMAs would bring the 141.2 – 141.9 resistance band into play.
The 14-4H RSI reading of 37.47 sends bearish signals, with selling pressure outweighing buying pressure. Notably, the RSI aligns with the EMAs and supports a fall through the 139.5 – 138.8 support band to bring sub-138 into view.
About the Author
Bob Masonauthor
With over 20 years of experience in the finance industry, Bob has been managing regional teams across Europe and Asia and focusing on analytics across both corporate and financial institutions. Currently he is covering developments relating to the financial markets, including currencies, commodities, alternative asset classes, and global equities.
Did you find this article useful?
Latest news and analysis


Advertisement