
Advertisement
Advertisement
USD/JPY Bears Eye Sub-140 on the Fed and BoJ Tweak Theory
By:
It is a busy day for the USD/JPY. After Fed Chair Powell's fence sitting, US GDP numbers will be in focus as investors begin considering the BoJ decision.

In this article:
Highlights
- It will be a testy second half of the week for the USD/JPY.
- While we expect further reaction to the Fed Chair Powell press conference, US stats, Japan inflation, and the Bank of Japan remain in focus.
- The near-term technical indicators are bearish, signaling a return to sub-140.
On Wednesday, the USD/JPY fell by 0.46% to wrap up the day at 140.237. The Fed interest rate decision and the Fed Chair Powell press conference left the greenback on the back foot.
This morning, there are no economic indicators from Japan or China to move the dial. The lack of economic indicators will leave sentiment toward the Fed and BoJ interest rate decisions to move the dial.
The markets expect the Bank of Japan to begin moving away from its ultra-loose monetary policy stance. Initially, the Yield Curve Control Policy will be the likely focal point. A shift away from ultra-loose and an end to the Fed monetary policy tightening cycle would tip the scales in favor of the Yen.
The US Session
US core durable goods and jobless claims will draw interest. However, prelim Q2 GDP numbers should have more impact. Fed Chair Powell and the markets are betting on a soft landing. Weaker-than-expected GDP numbers would reignite recessionary fears in the wake of the Fed 25-basis point interest rate hike.
While the GDP number will be the focal point, jobless claims numbers should continue reflecting tight labor market conditions. Tight labor market conditions would support consumer confidence and spending, both material to service sector activity. However, tight labor market conditions would leave a September Fed rate hike on the table.
USD/JPY Price Action
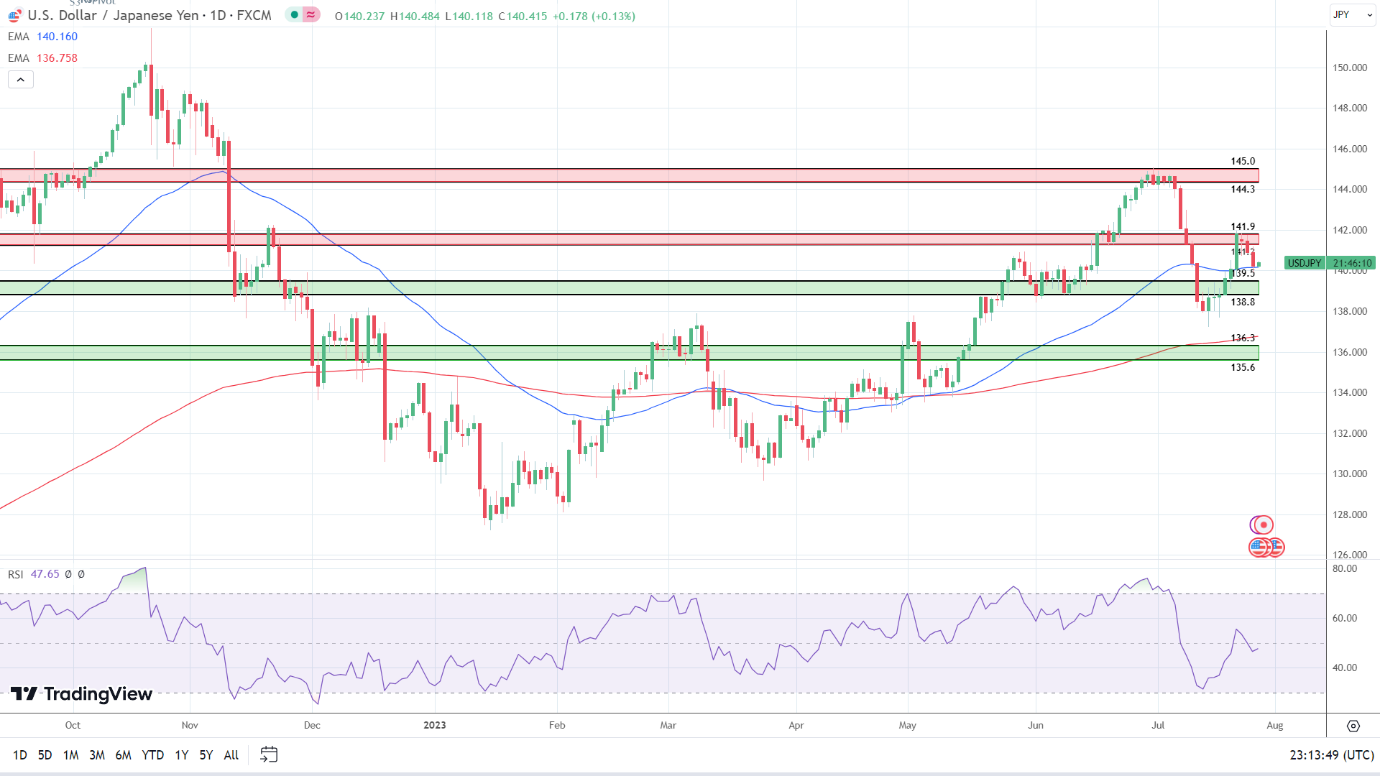
Daily Chart
The Daily Chart showed the USD/JPY hovered below the 141.2 – 141.9 resistance band. Despite a third day in the red, the USD/JPY remained above the 50-day (140.160) and 200-day (136.758) EMAs, sending bullish near and longer-term time price signals.
Notably, the 50-day EMA pulled further away from the 200-day EMA, affirming the near-term bullish trend.
However, looking at the 14-Daily RSI, the 47.51 reading signals a bearish outlook, supporting a fall through the 50-day EMA (140.159) to target the 139.5 – 138.8 support band. However, a hold above the 50-day EMA would give the bulls a run at the 141.2 – 141.9 resistance band.
Price action today is hinged on US economic indicators and bets on a BoJ tweak.
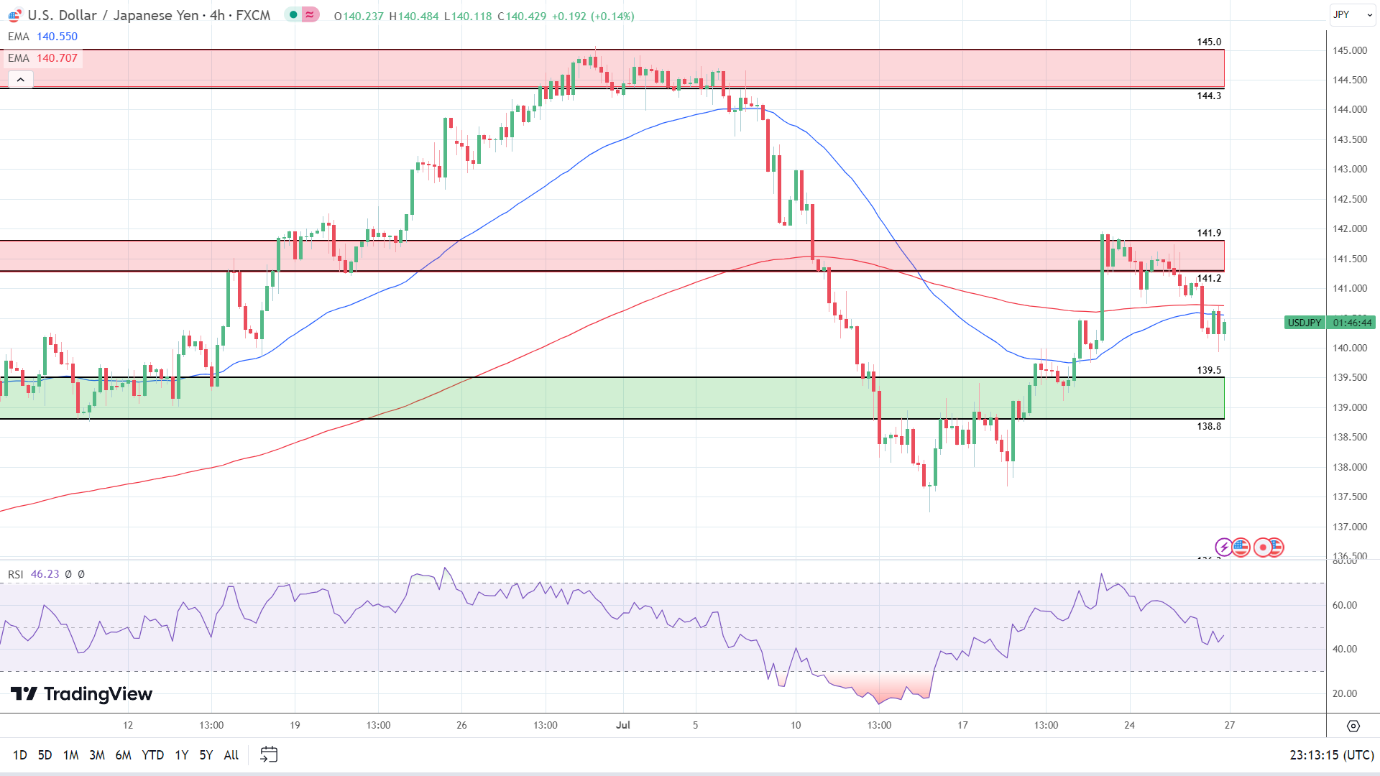
4-Hourly Chart
Looking at the 4-Hourly Chart, the USD/JPY faces strong resistance at 140.5. However, the USD/JPY sits below the 200-day (140.707) and 50-day (140.550) EMAs, sending bearish near and longer-term price signals.
Significantly, the 50-day EMA pulled back from the 200-day EMA, signaling a run at the 139.5 – 138.8 support band. However, a USD/JPY move through the EMAs would bring the 141.2 – 141.9 resistance band into play.
The 14-4H RSI reading of 46.23 sends bearish signals, with selling pressure outweighing buying pressure. Notably, the RSI aligns with the EMAs and supports a run at the 139.5 – 138.8 support band.
Price action today is hinged on US economic indicators and bets on a BoJ tweak.
About the Author
Bob Masonauthor
With over 20 years of experience in the finance industry, Bob has been managing regional teams across Europe and Asia and focusing on analytics across both corporate and financial institutions. Currently he is covering developments relating to the financial markets, including currencies, commodities, alternative asset classes, and global equities.
Did you find this article useful?
Latest news and analysis


Advertisement