
Advertisement
Advertisement
AUD to USD Forecast: Fed Angst Leaves Sub-$0.67 in Play
By:
It is a quiet start to the day for the AUD to USD. However, US economic indicators, Politburo chatter, and Fed Fear will influence today.

In this article:
Highlights
- It is a quiet morning for the AUD/USD, with no economic indicators from Australia or China to move the dial.
- However, investor apprehension ahead of the Fed meeting could offset hopes of fresh stimulus from the Politburo meeting.
- The near-term technical indicators remained bearish, signaling a return to sub-$0.67.
On Monday, the AUD/USD gained 0.18% to end the day at $0.67389, with inflation and hawkish RBA bets providing support. Flash PMI numbers for July failed to spook investors, despite gloomy PMI numbers from Australia and Europe.
This morning, there are no economic indicators from Australia or China to provide direction. The lack of stats will leave investors to focus on the Politburo meeting and the Fed interest rate decision.
The US Session
US consumer confidence numbers for July will move the dial this afternoon. Economists forecast the CB Consumer Confidence Index to rise from 109.7 to 111.5.
An upward trend in the US CB Consumer Confidence Index would signal a pickup in consumption that would fuel demand-driven inflationary pressure. The numbers could influence the Fed, with consumers likely responding to bets on the Fed hitting the proverbial brakes.
AUD/USD Price Action
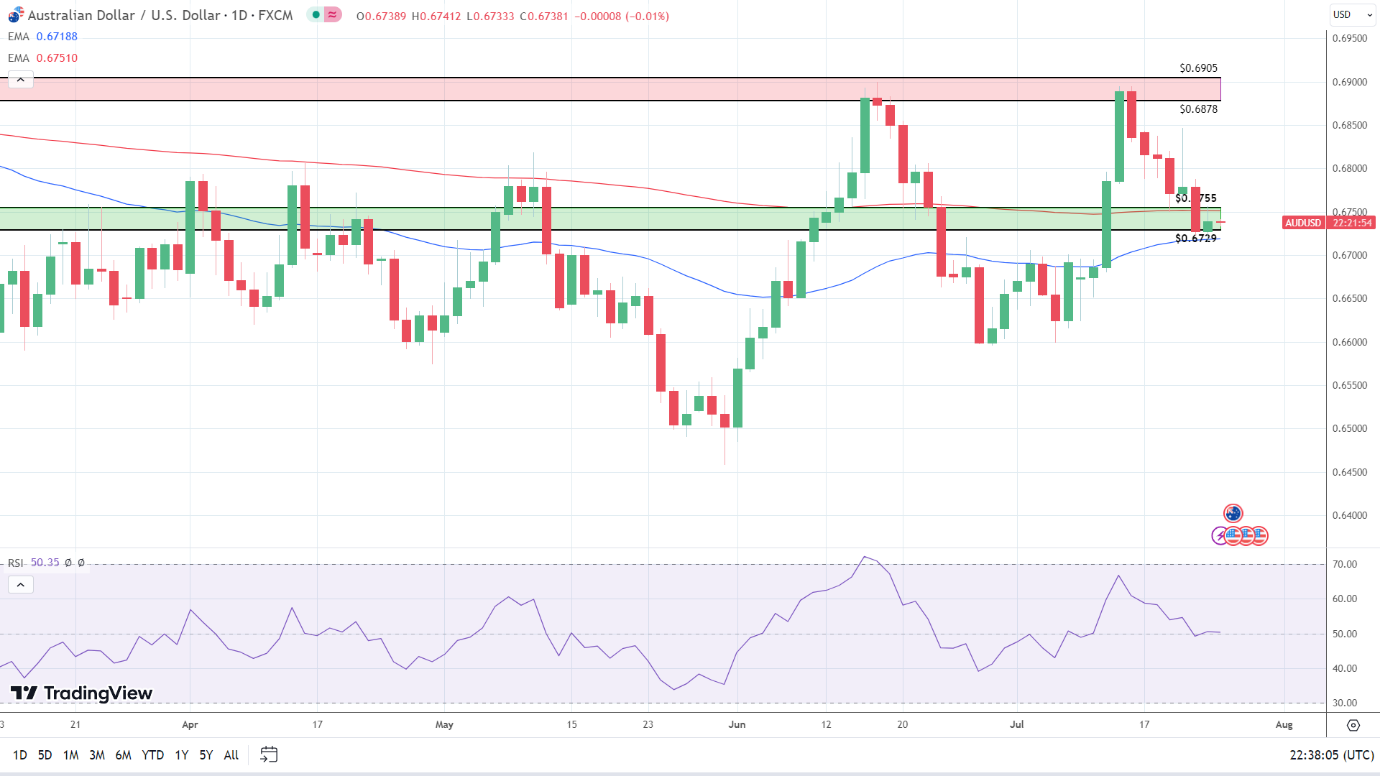
Daily Chart
The Daily Chart showed the AUD/USD find support at the lower level of the $0.6755 – $0.6729 support band on Monday.
Notably, the AUD/USD remained below the 200-day EMA ($0.67510) while holding above the 50-day EMA ($0.67188), sending bullish near-term but bearish longer-term price signals.
After the bullish Monday session, the 50-day EMA narrowed to the 200-day EMA, supporting a more bullish near-term outlook.
Looking at the 14-Daily RSI, the 50.35 reading signals a moderately bullish trend and supports a move through the 200-day EMA $0.67510 and the upper level of the $0.6755 – $0.6729 support band to target $0.68. However, an AUD/USD fall through the $0.6755 – $0.6729 support band and the 50-day EMA ($0.67188) would bring sub-$0.67 into play.
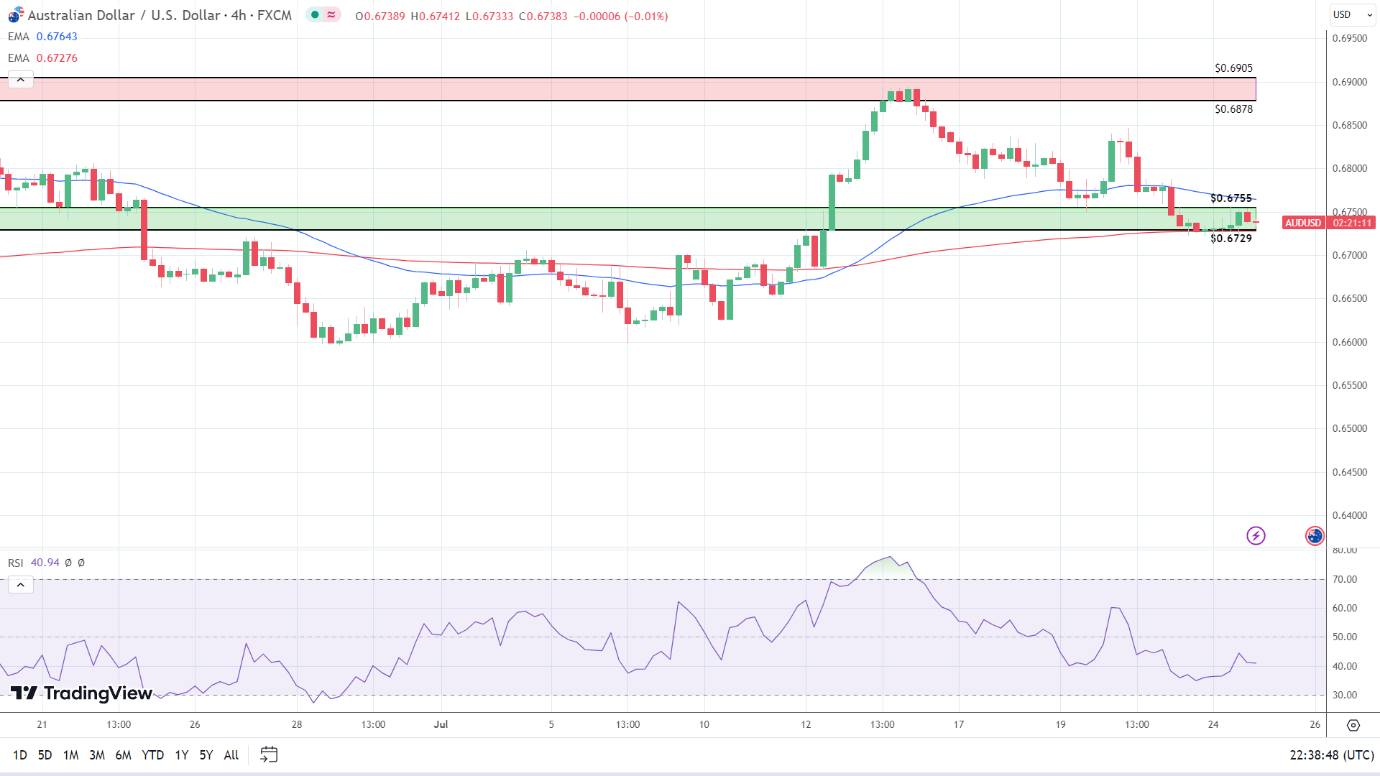
4-Hourly Chart
Looking at the 4-Hourly Chart, the AUD/USD hovers at the lower level of the $0.6755 – $0.6729 support band. The AUD/USD remains below the 50-day EMA ($0.67643) while holding above the 200-day EMA ($0.67276), sending bearish near-term but bullish longer-term price signals.
Significantly, the 50-day EMA narrowed on the 200-day EMA, supporting a return to sub-$0.67. However, a move through the $0.6729 – $0.6755 support band would bring the 50-day EMA ($0.67643) and $0.68 into play.
Looking at the RSI indicator, the 14-4H RSI reading of 40.94 indicates bearish momentum, with selling pressure outweighing buying pressure. The RSI is aligned with the 50-day EMA, supporting a return to sub-$0.67.
About the Author
Bob Masonauthor
With over 20 years of experience in the finance industry, Bob has been managing regional teams across Europe and Asia and focusing on analytics across both corporate and financial institutions. Currently he is covering developments relating to the financial markets, including currencies, commodities, alternative asset classes, and global equities.
Did you find this article useful?
Latest news and analysis


Advertisement