
Advertisement
Advertisement
AUD to USD Forecast: Bulls to Target $0.6850 on RBA Bets
By:
It was a bullish start to the day for the AUD to USD. However, with stats to consider, the Australian employment numbers should provide support.

In this article:
Highlights
- It is a quiet morning for the AUD/USD, with no economic indicators from China or Australia to influence.
- After the RBA meeting minutes and the employment numbers, monetary policy divergence narrowed in favor of the Aussie Dollar.
- The longer-term technical indicators remain bullish, supporting a run at $0.70.
On Thursday, the AUD/USD gained by 0.11% to end the day at $0.67787. Better-than-expected employment figures from Australia fueled bets on further RBA rate hikes, supporting a brief Aussie dollar return to $0.68.
While the RBA minutes revealed the willingness to push the cash rate higher, Board members expected inflation to soften and capacity pressures to ease. However, the employment numbers suggest that capacity pressures may linger and fuel a pickup in wage growth.
Tight labor market conditions lead to a pickup in wage growth due to a lack of skilled labor. Wage growth translates into increased spending power that drives demand for goods and services, straining supplies and leading to increased price pressure.
There are no economic indicators from Australia or China to influence this morning, leaving RBA bets to move the dial.
The US Session
It is a quiet day ahead on the US economic calendar. There are no US economic indicators to move the dial later in the day. The lack of economic indicators will leave the AUD/USD in the hands of market risk sentiment and sentiment toward the respective economies and monetary policy outlooks.
AUD/USD Price Action
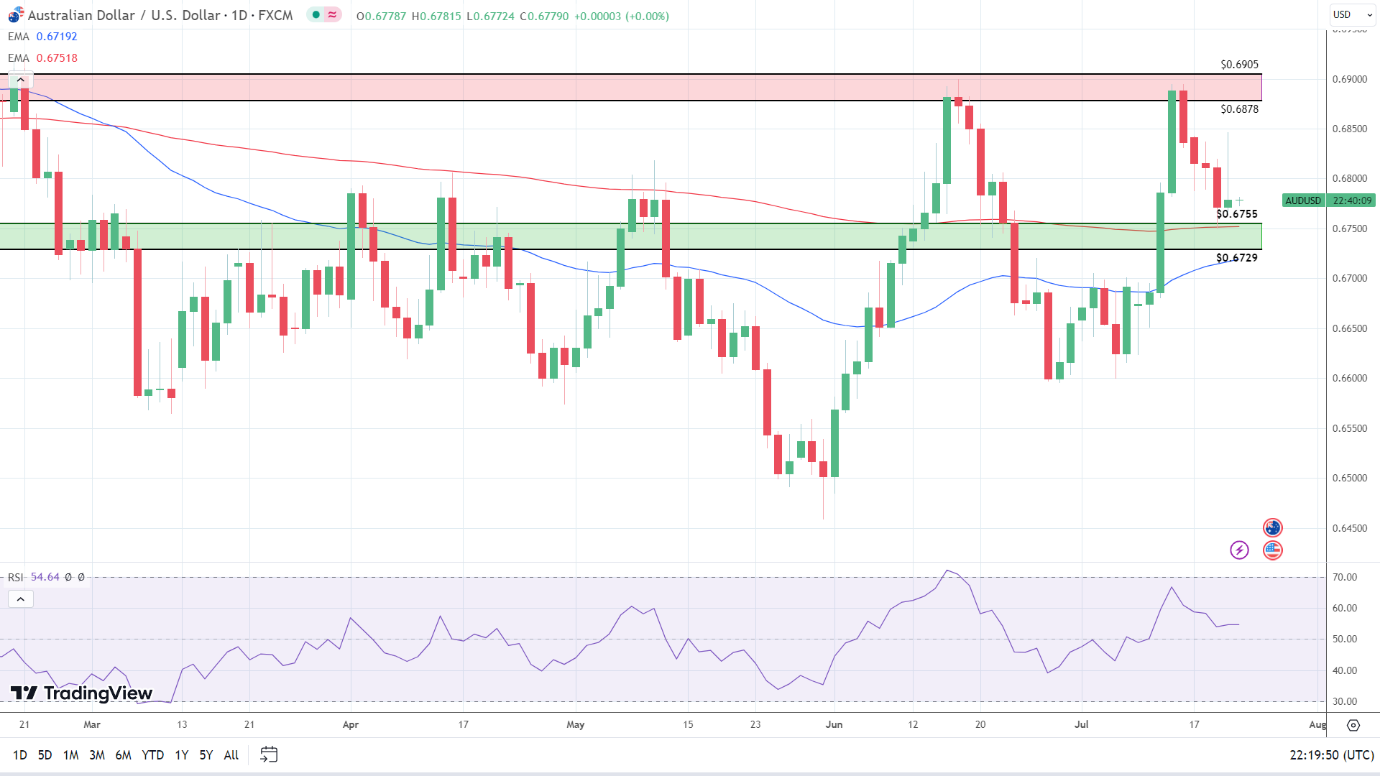
Daily Chart
The Daily Chart showed the AUD/USD fall back to sub-$0.68 on Thursday after briefly testing resistance at $0.6850.
Notably, the AUD/USD remained above the 50-day ($0.67192) and 200-day ($0.67518) EMAs, signaling bullish momentum over the near and longer-term time horizons.
After the bullish Thursday session, the 50-day EMA closed in on the 200-day EMA, supporting the bullish nearer-term outlook.
Looking at the 14-Daily RSI, the 54.64 reading signals a bullish trend and supports a move through $0.68 to target the $0.6878 – $0.6905 resistance band. However, a fall through the upper level of the $0.6755 – $0.6729 support band and the 200-day EMA ($0.67518) would bring the 50-day EMA ($0.67192) into play.
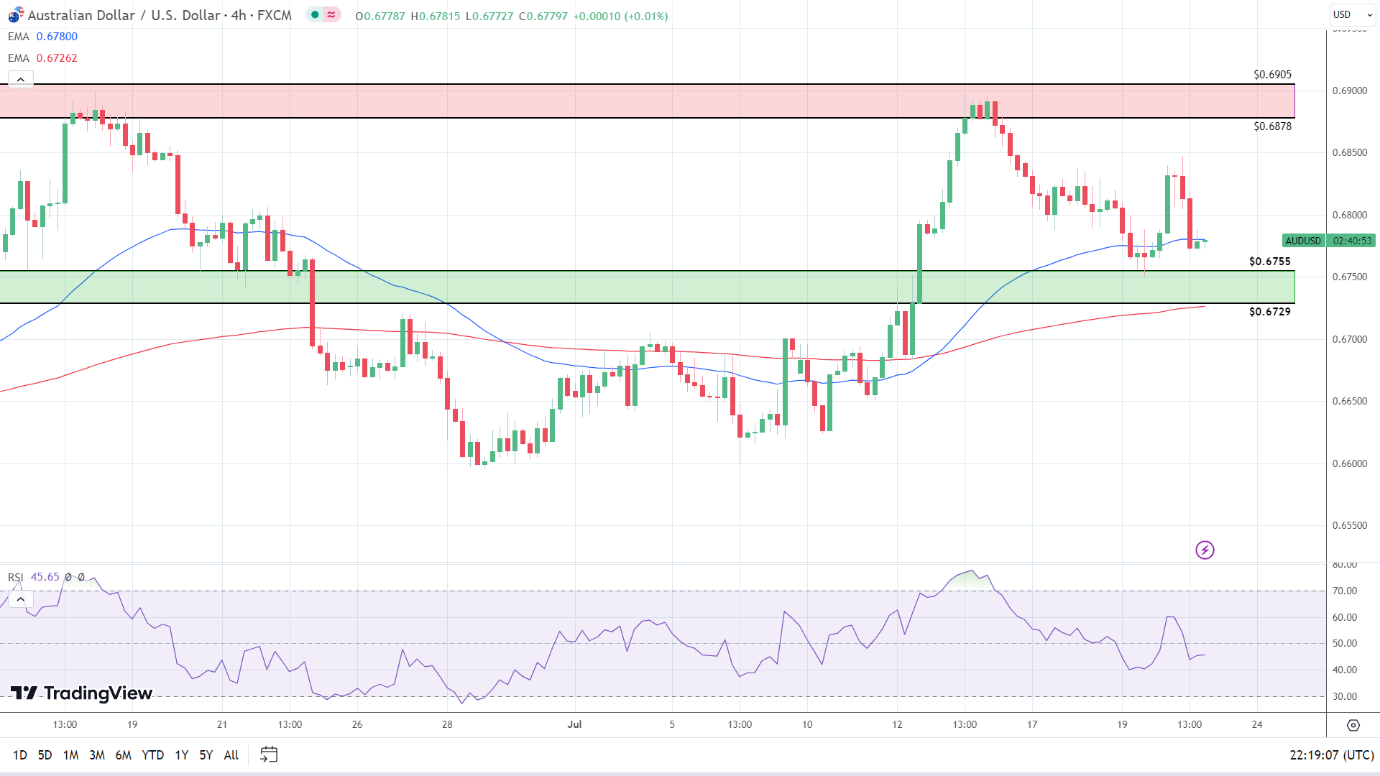
4-Hourly Chart
Looking at the 4-Hourly Chart, the AUD/USD sits above the $0.6755 – $0.6729 support band. Despite the bullish Thursday session, the AUD/USD remains below the 50-day EMA ($0.67800), a bearish signal. However, the AUD/USD remains above the 200-day EMA ($0.67262), sending bullish longer-term signals.
Significantly, the 50-day EMA narrowed on the 200-day EMA, supporting a run at the $0.6755 – $0.6729 support band and the 200-day EMA ($0.67262). The AUD/USD must avoid the $0.6755 – $0.6729 support band to break out from the 50-day EMA ($0.67800) and retarget $0.68.
Looking at the RSI indicator, the 14-4H RSI reading of 45.65 indicates bearish momentum, with selling pressure outweighing buying pressure. The RSI is aligned with the 50-day EMA and supports a run at the $0.6755 – $0.6729 support band and the 200-day EMA ($0.67214).
About the Author
Bob Masonauthor
With over 20 years of experience in the finance industry, Bob has been managing regional teams across Europe and Asia and focusing on analytics across both corporate and financial institutions. Currently he is covering developments relating to the financial markets, including currencies, commodities, alternative asset classes, and global equities.
Did you find this article useful?
Latest news and analysis


Advertisement