
Advertisement
Advertisement
AUD/USD and NZD/USD Fundamental Analysis: China Trade Up Next
By:
It is a busy day for the AUD/USD and the Kiwi. After the Wednesday breakout, China trade data will test the bullish sentiment ahead of the US sessison.

In this article:
Highlights
- The AUD/USD and the NZD/USD found early support after the Wednesday breakout.
- This morning, economic indicators from New Zealand drew interest ahead of trade data from China.
- However, US PPI wholesale inflation and jobless claims numbers will also need consideration later today.
It is a relatively busy start to the day for the NZD/USD. Electronic card retail sales and Business PMI numbers for June were in focus. After the RBNZ Rate Statement on Wednesday, the electronic card retail sales figures drew more interest.
Electronic card retail sales increased by 1.0% in June versus a 1.7% decline in May. Economists forecast a 0.2% decline. The increase in consumption could test the RBNZ theory of ending the monetary policy tightening schedule.
Business PMI numbers were less upbeat, with the PMI falling from 48.9 to 47.5 in June versus a forecasted 49.8.
Later this morning, trade data from China will impact the AUD/USD and the Kiwi by proxy. While the markets expect more stimulus from Beijing, another set of weak numbers would likely weigh on the pairings and riskier assets.
The European Session
It is a relatively busy day ahead on the European economic calendar. Eurozone industrial production numbers for May will draw interest. The jury is out on whether the euro area can avoid a deep ECB-fueled recession. An unexpected fall in production would question the ECB’s hawkish policy outlook.
Other economic indicators include finalized inflation numbers from France. However, the inflation figures should not impact the global financial markets.
Later in the session, the ECB monetary policy meeting minutes and central bank commentary will draw interest. The ECB will release the monetary policy meeting minutes, with ECB President Christine Lagarde and Mr. Fabio Panetta attending the Eurogroup meeting in Brussels.
The US Session
It is a relatively busy day on the US economic calendar. After the US CPI Report, the focus will turn to wholesale inflation numbers that could further influence Fed policy expectations. Other stats include the weekly jobless claims figures that would need to spike to draw interest.
AUD/USD Price Action
Daily Chart
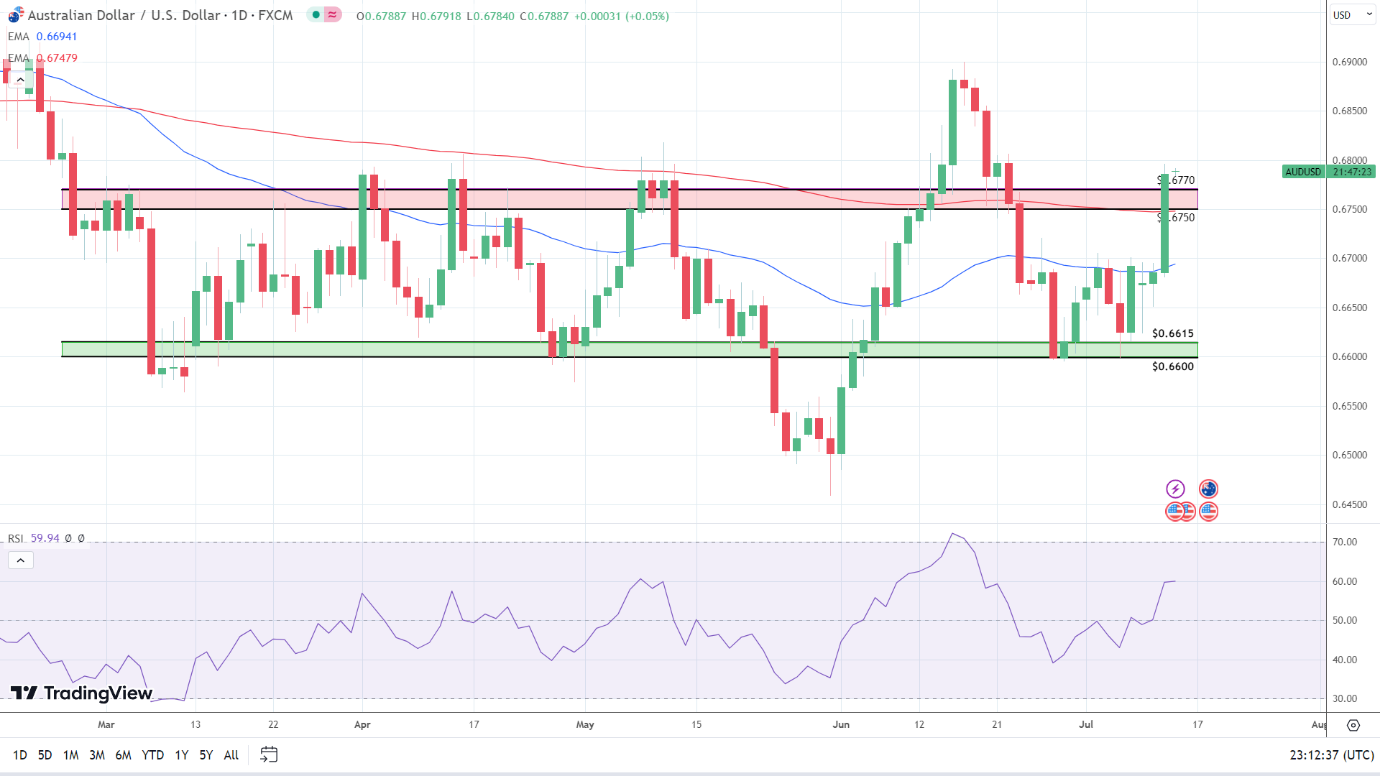
The Daily Chart showed the AUD/USD sitting below the psychological $0.68 resistance level but above the $0.6770 – $0.6750 resistance band.
Notably, the AUD/USD remained above the 50-day ($0.66941) and 200-day ($0.67479) EMAs, signaling bullish momentum over the near and longer-term time horizons.
The 50-day EMA pulled away from the 200-day EMA and reflected bullish momentum following the breakout Wednesday session.
Looking at the 14-Daily RSI, the 59.94 reading signals a bullish trend and suggests a move through $0.68 to target $0.6850. However, a fall through the upper level of the $0.6770 – $0.6750 resistance band could reverse the Wednesday breakout.
4-Hourly Chart
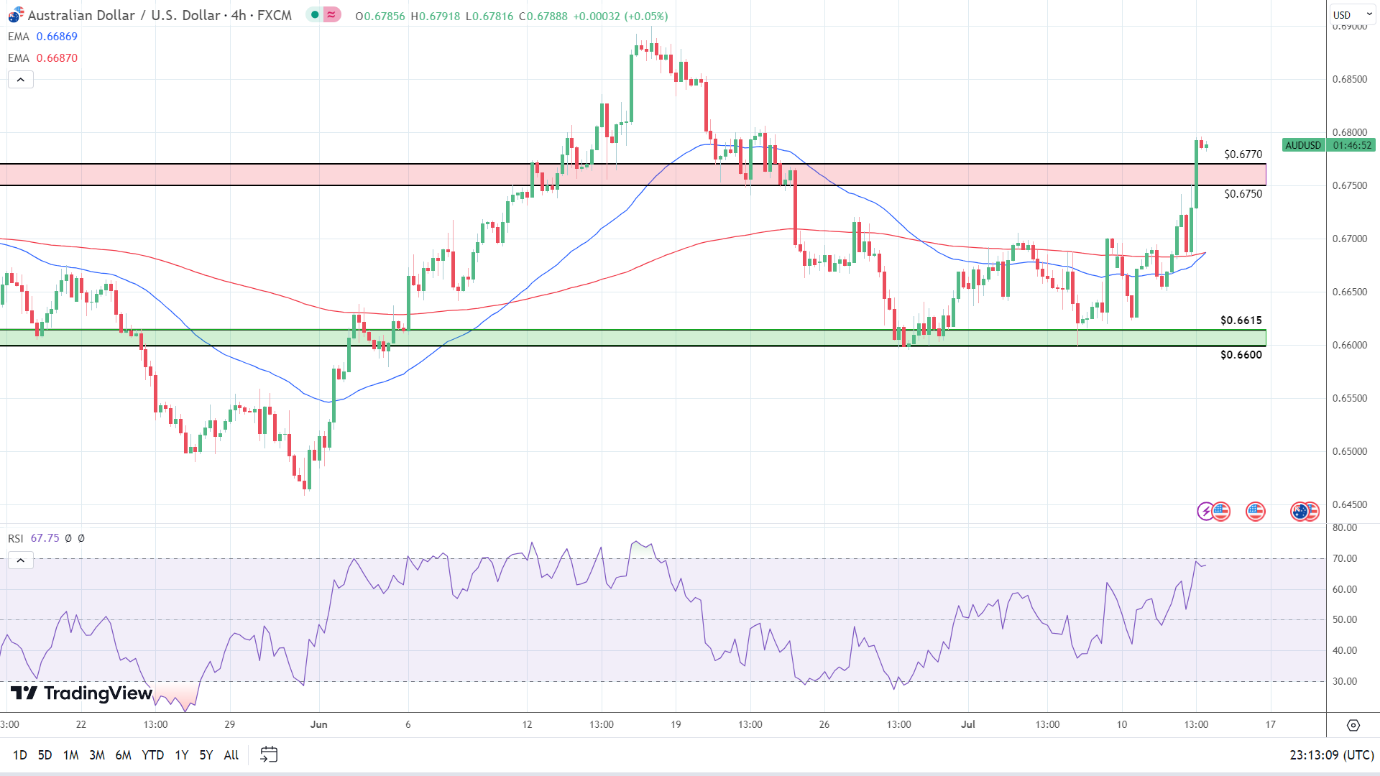
Looking at the 4-Hourly Chart, the AUD/USD faces strong resistance at the $0.68 psychological level. After the Wednesday session, the AUD/USD sits above the 50-day ($0.66869) and 200-day ($0.66870) EMAs, sending signals. Significantly, the 50-day EMA converged on the 200-day EMA. A bullish cross would support a breakout from $0.68 to bring $0.6850 into view.
However, the AUD/USD must hold above the $0.6770 – $0.6750 resistance band to target $0.6850.
Looking at the RSI indicator, the 14-4H RSI reading of 67.76 indicates a bullish stance, with buying pressure outweighing selling pressure. The RSI is aligned with EMAs and supports a run at $0.6850.
NZD/USD Price Action
Daily Chart
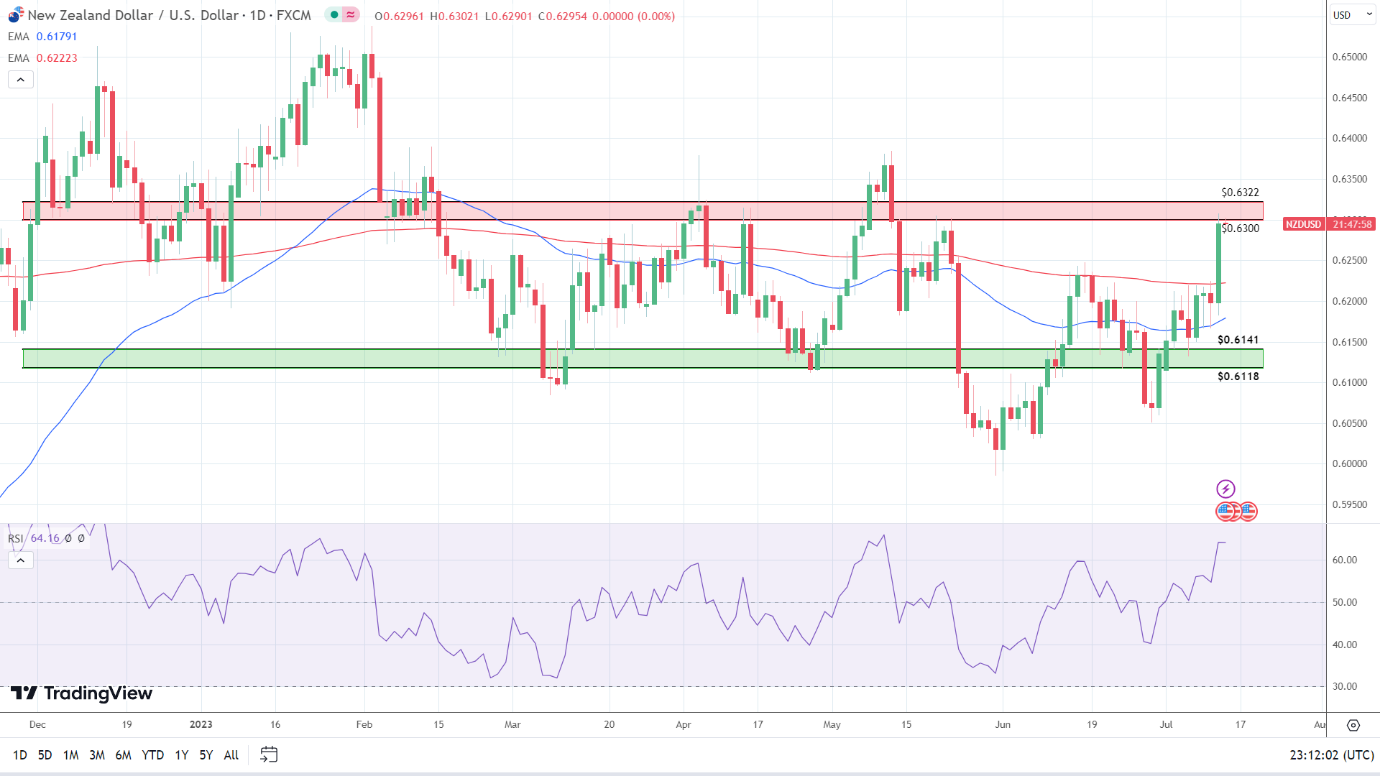
The Daily Chart showed the NZD/USD holding above the $0.6250 psychological level after a bullish Wednesday session. Significantly, the EMAs sent bullish signals. The Kiwi dollar sat above the 50-day ($0.61791) and 200-day ($0.62223).
Notably, the 50-day EMA narrowed on the 200-day EMA, reflecting bullish momentum over the near and longer-term time horizons.
Looking at the 14-Daily RSI, the 64.16 reading signals a trend, supporting a breakout from the lower level of the $0.6300 – $0.6322 resistance band.
4-Hourly Chart
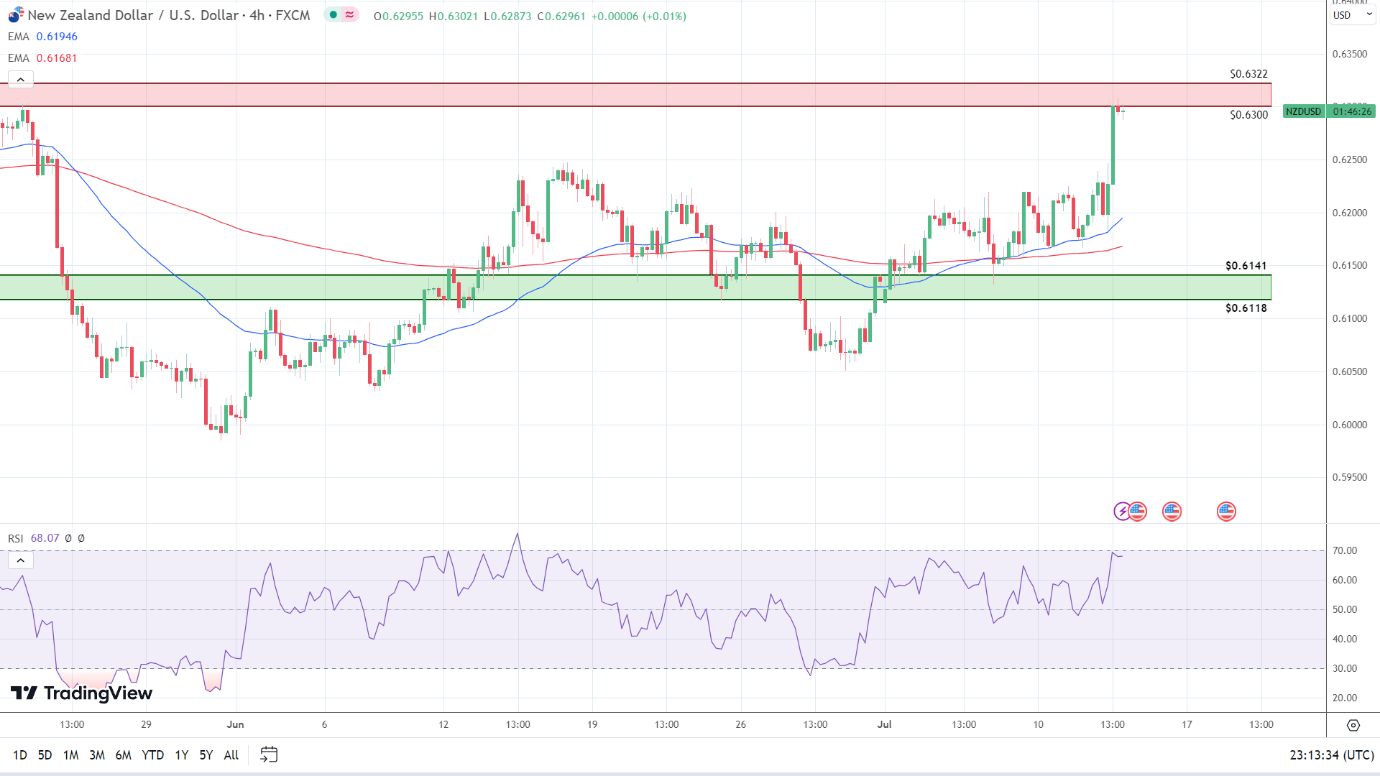
Looking at the 4-Hourly Chart, the NZD/USD faces strong resistance at the $0.63 psychological level. After the bullish Wednesday session, the NZD/USD sits above the 50-day ($0.61946) and 200-day ($0.61681) EMAs, supporting a breakout from the lower level of the $0.6300 – $0.6322 resistance band.
Notably, the 50-day EMA pulled further away from the 200-day EMA, a bullish signal.
The 14-4H RSI reading of 68.07 indicates a bullish trend, with buying pressure outweighing selling pressure. Significantly, the 14-4H RSI aligns with the EMAs and signals a breakout from the lower level of the $0.6300 – $0.6322 resistance band.
About the Author
Bob Masonauthor
With over 20 years of experience in the finance industry, Bob has been managing regional teams across Europe and Asia and focusing on analytics across both corporate and financial institutions. Currently he is covering developments relating to the financial markets, including currencies, commodities, alternative asset classes, and global equities.
Did you find this article useful?
Latest news and analysis


Advertisement