
Advertisement
Advertisement
AUD/USD and NZD/USD Fundamental Analysis: RBNZ in the Spotlight
By:
It is a quiet start to the day for the AUD/USD. However, the RBNZ could deliver a surprise to the Kiwi dollar as monetary policy uncertainty lingers.

In this article:
Highlights
- The AUD/USD and the NZD/USD had a mixed start to the day.
- This morning, the RBNZ will deliver its July interest rate decision amidst a more dovish Fed backdrop.
- However, the US CPI Report could reignite hawkish Fed bets later today.
It is a relatively quiet start to the day, with no economic indicators to provide direction to the AUD/USD and NZD/USD.
However, while there are no economic indicators to consider, the RBNZ will deliver its July interest rate decision later this morning.
Economists expect the RBNZ to stand pat on interest rates, shifting the market focus to the Rate Statement. In April, the RBNZ surprised the markets with a 50-basis point interest rate hike before raising rates by a further 25-basis points to 5.50% in May.
With the RBNZ known to deliver surprises, we expect a pickup in Kiwi dollar volatility before the announcement.
While the RBNZ will likely grab the headlines, RBA Governor Philip Lowe is on the calendar to speak this morning. Hawkish commentary should deliver a pre-US session Aussie dollar breakout.
The European Session
It is a quiet day ahead on the European economic calendar. Finalized Spanish inflation numbers are out but will unlikely influence market risk sentiment.
With the economic calendar on the light side, ECB commentary will need consideration. ECB Chief Economist Philip Lane is on the calendar to speak and will garner plenty of attention.
With the markets set on a 25-basis point interest rate hike in July, the jury is still out about the September meeting, with the ECB taking a data-dependent stance on monetary policy decisions. References to the September decision would move the dial.
The US Session
It is a big day on the US economic calendar. The US CPI Report will be in focus. Sticky inflation would fuel bets on a September interest rate hike. This week, less hawkish Fed commentary weighed on the greenback. Economists forecast the US annual inflation rate to soften from 4.0% to 3.1%.
FOMC member chatter of the Fed nearing the end of its monetary policy tightening cycle supported the pairings ahead of today’s session.
According to the CME FedWatch Tool, the probability of a 25-basis point July Fed rate hike was 92.4% versus 93.0% on Monday. Significantly, the chances of the Fed lifting rates to 5.75% in September stood at 24.0%, up from 22.3% on Monday.
AUD/USD Price Action
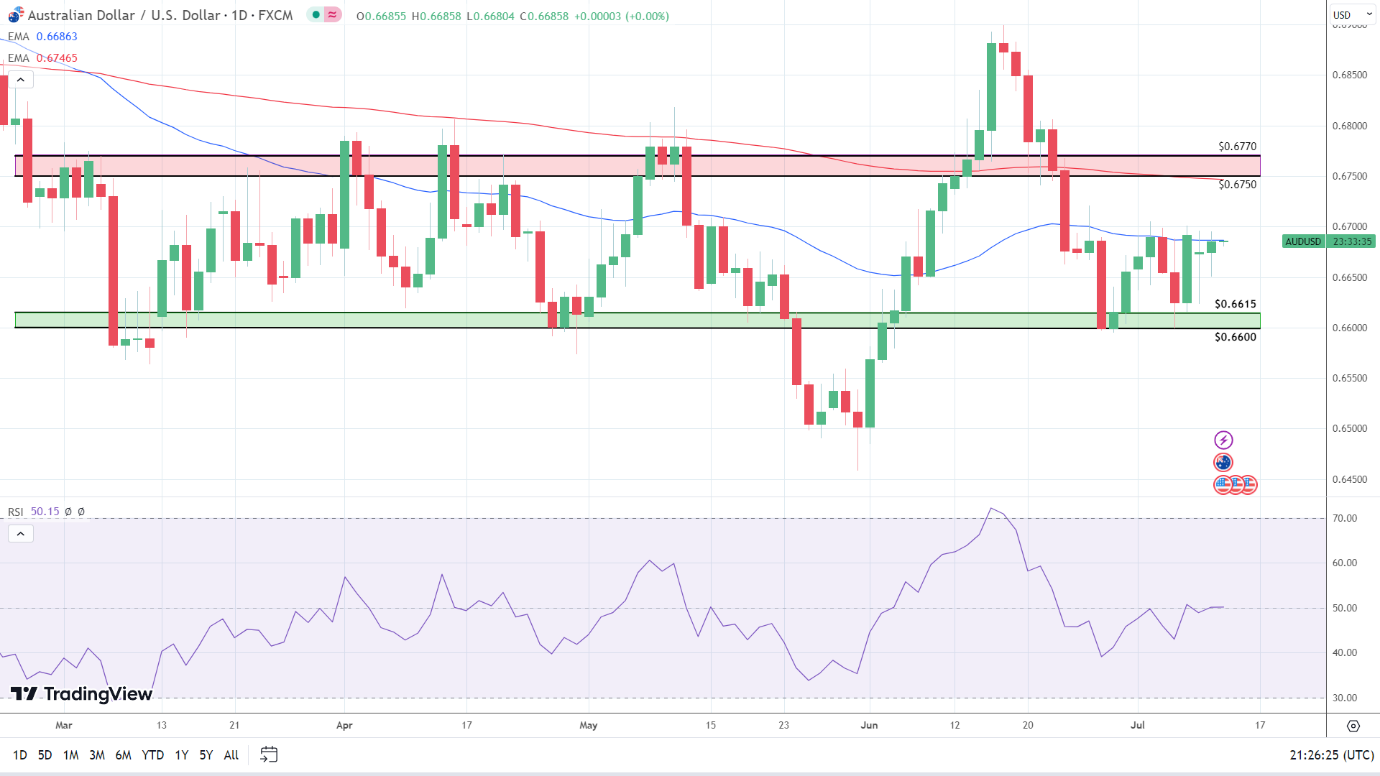
Daily Chart
The Daily Chart showed the AUD/USD sitting below the psychological $0.67 resistance level and the $0.6750 – $0.6770 resistance band.
Notably, the AUD/USD remained below the 50-day ($0.66863) and 200-day ($0.67465) EMAs, signaling bearish momentum over the near and longer-term time horizons.
The 50-day EMA eased back from the 200-day EMA and reflected bearish momentum following the choppy Monday session.
Looking at the 14-Daily RSI, the 50.15 reading signals a moderately bullish trend and suggests a move through the 50-day EMA ($0.66863) to target the 200-day EMA ($0.67465). However, failure to break out from the 50-day EMA would leave the $0.6615 – $0.6600 support band in view.
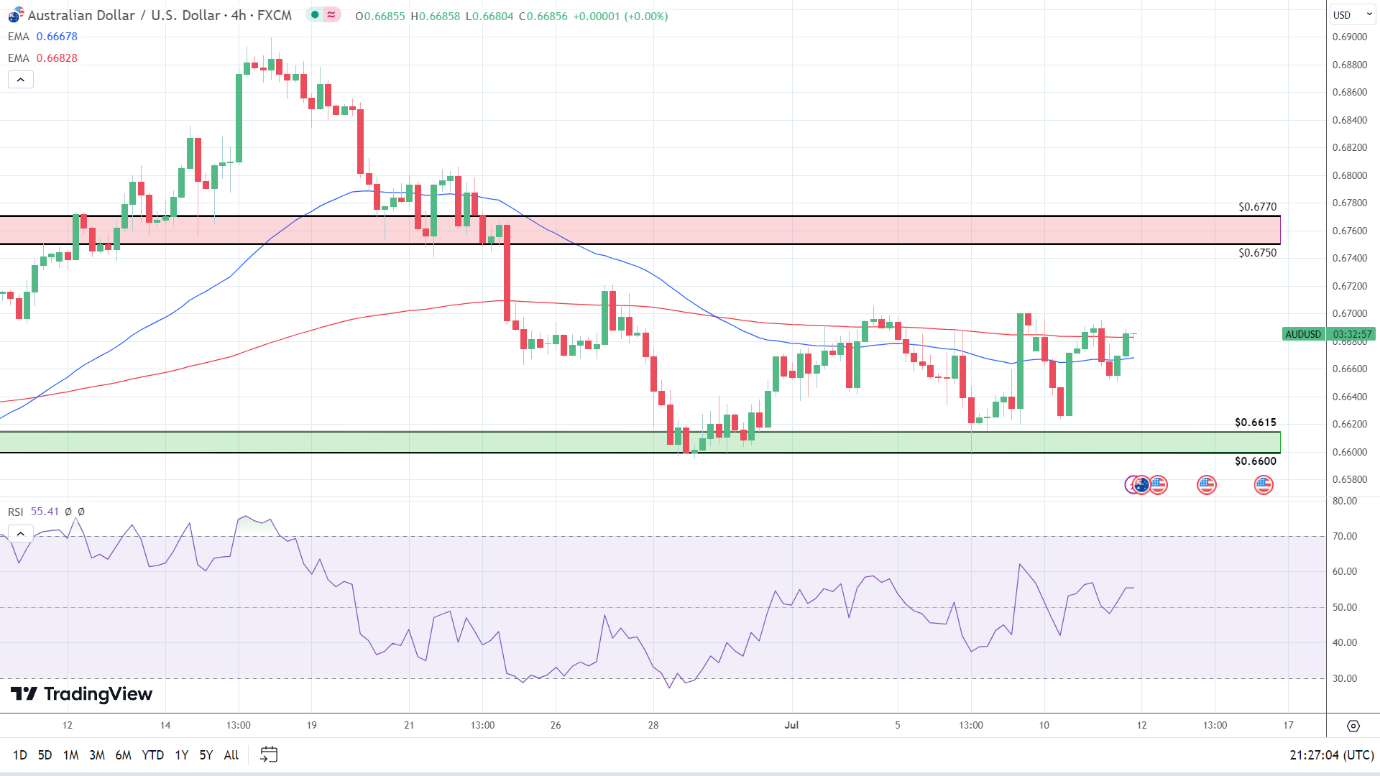
4-Hourly Chart
Looking at the 4-Hourly Chart, the AUD/USD faces strong resistance at the $0.67 psychological level. After the Tuesday session, the AUD/USD sits above the 50-day ($0.66678) and 200-day ($0.66828) EMAs, sending bullish signals. Significantly, the 50-day EMA narrowed to the 200-day EMA, signaling a run at the $0.6750 – $0.6770 resistance band.
However, the AUD/USD must hold above the 200-day EMA to retarget $0.67. A fall through the 200-day ($0.66828) and 50-day ($0.66678) EMAs would bring the upper level of the $0.6615 – $0.6600 support band into view.
Looking at the RSI indicator, the 14-4H RSI reading of 55.41 indicates a moderately bullish stance, with buying pressure outweighing selling pressure. The RSI is aligned with EMAs and supports a run at the lower level of the $0.6750 – $0.6770 resistance band.
NZD/USD Price Action
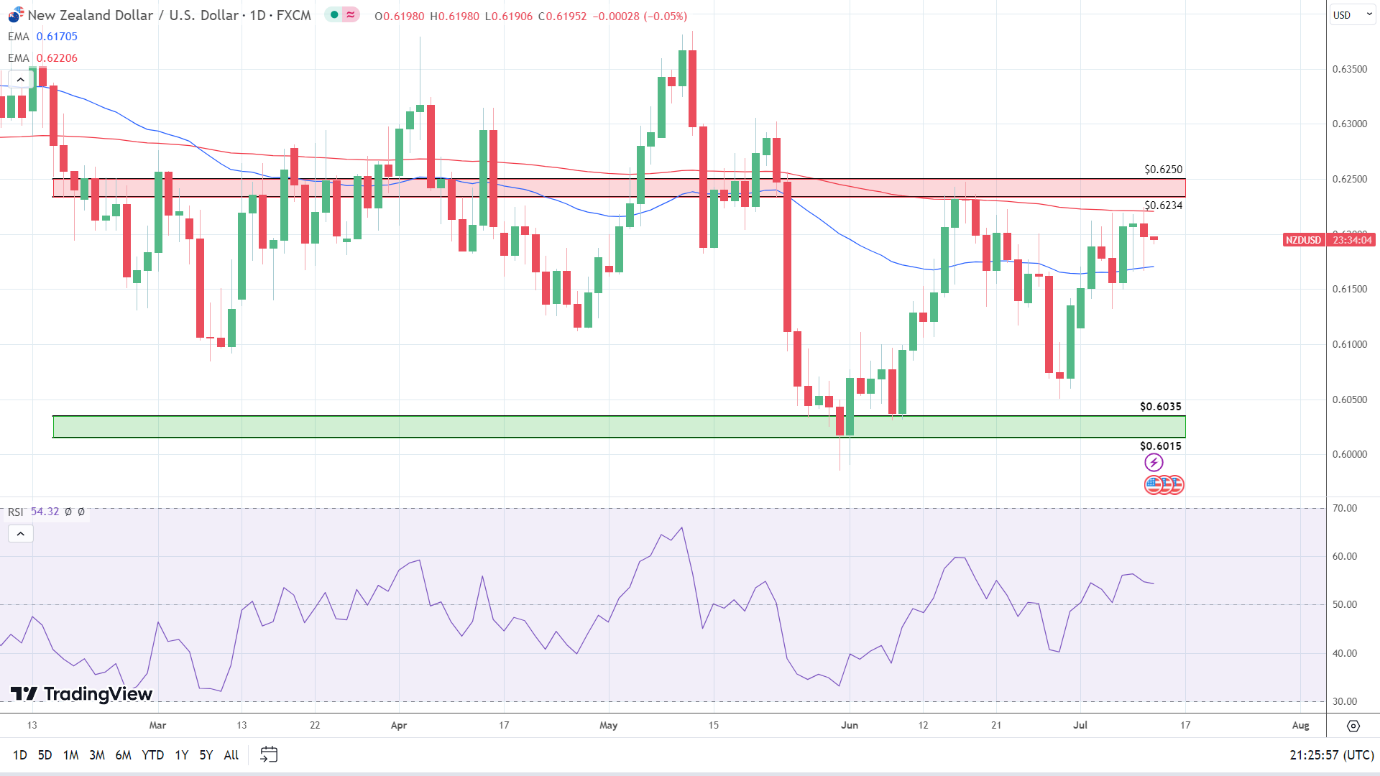
Daily Chart
The Daily Chart showed the NZD/USD fall through the $0.6200 psychological level on a testy Tuesday session. Significantly, the EMAs sent mixed signals. The Kiwi dollar sat above the 50-day EMA ($0.61705) while below the 200-day EMA ($0.62206).
Notably, the 50-day EMA narrowed on the 200-day EMA, reflecting bullish momentum over the near term but bearish over the longer-term time horizon.
Looking at the 14-Daily RSI, the 54.32 reading signals a moderately bullish trend, supporting a run at the 200-day EMA ($0.62206) and the lower level of the $0.6234 – $0.6250 resistance band.
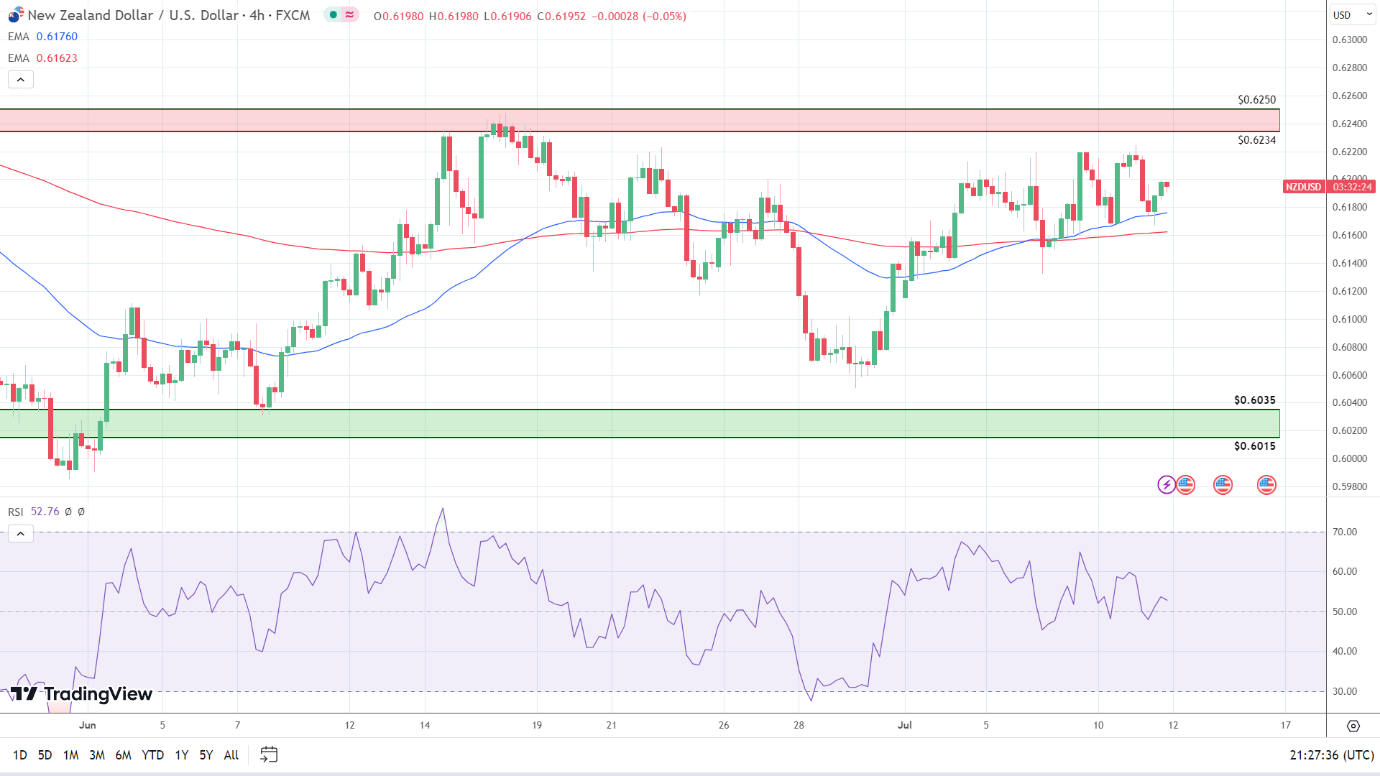
4-Hourly Chart
Looking at the 4-Hourly Chart, the NZD/USD faces strong resistance at the $0.62 psychological level. Despite the bearish Tuesday session, the NZD/USD sits above the 50-day ($0.61760) and 200-day ($0.61623) EMAs, supporting a run at the $0.6234 – $0.6250 resistance band.
Notably, the 50-day EMA pulled further away from the 200-day EMA, a bullish signal.
The 14-4H RSI reading of 52.76 indicates a moderately bullish trend, with buying pressure outweighing selling pressure. Significantly, the 14-4H RSI aligns with the EMAs and signals a run at the $0.6234 – $0.6250 resistance band.
About the Author
Bob Masonauthor
With over 20 years of experience in the finance industry, Bob has been managing regional teams across Europe and Asia and focusing on analytics across both corporate and financial institutions. Currently he is covering developments relating to the financial markets, including currencies, commodities, alternative asset classes, and global equities.
Did you find this article useful?
Latest news and analysis


Advertisement