Fed's Dot Plot To Show More Tightening On The Cards
Authored by Ven Ram, Bloomberg cross-asset strategist,
Investors are underpricing the possibility that the Federal Reserve will telegraph a higher peak rate with its new dot plot this week.
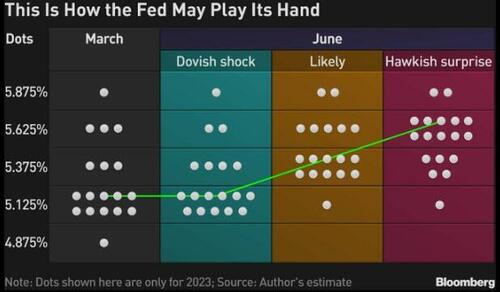
The median of FOMC members’ indications will show an additional one or two hikes, while a couple of them may pencil in more tightening than that. Should the median show more than one increase, Treasuries are bound to sell off.
The Fed will need to revise its dot plot to acknowledge that it isn’t done with its efforts to quell inflation that is still running well above its own estimates.
Interest-rate traders aren’t quite positioned for the Fed to keep tightening, with meeting-dated swaps assigning only about a 70% chance of an increase in July — and no hikes beyond then.
Over in Treasuries, front-end notes are trading at a rich premium. At the current level of around 4.60%, the two-year maturity is, based on historical correlations, trading as though the Fed is poised to cut its benchmark by about 50 basis points imminently.
The Fed’s benchmark rate is currently at the median rate indicated in its March dot plot. However, even back then, seven of 18 members thought a rate higher the current level would be needed to quell inflation.
Given that the Fed has adopted a slowly-slowly approach to guiding the markets toward a higher and higher benchmark rate, the median may well show the peak rate at 5.4%. This will prepare the markets for another increase in July. If any subsequent hikes are required, the Fed will rely on the September dot plot to do so.
If the Fed’s revised dot plot on Wednesday doesn’t show a shift, equities and Treasuries would almost certainly rally and the dollar would weaken on conviction that the central bank is done with its fight against price pressures. That would also suggest the Fed views its current rate as being sufficiently restrictive, meaning policymakers will adopt a cautious, calibrated approach from here given that the economy is losing momentum even in the face of a labor market that is pretty tight.
However, an application of the Taylor Rule shows that the restrictive rate for the US economy based on current inflation read-outs is 6.55%, a level that will make the bond market distinctly uncomfortable.
The Fed has successively raised its estimate of the peak rate that will be required for this cycle since September 2021. Back then, the Fed’s benchmark rate was 0.125% and the Taylor Rule recommended a benchmark of 5.38% — something the policymakers were acutely aware of. In other words, the monetary authority chose not to rattle the markets with the amount of tightening that would be required to cool inflation.
Even a modest tightening that is likely to be indicated in this week’s dot plot may still not be enough to get the job done on inflation. In the four months through April, core PCE has averaged 4.7%, way above the Fed’s forecast of 3.6% for this year.
Front-end Treasuries are still glossing over all this, and a hawkish dot plot may alter the trajectory of yields.


