
Advertisement
Advertisement
AUD/USD and NZD/USD Fundamental Analysis: All Eyes on the Fed
By:
It is a quiet morning for the AUD/USD and the Kiwi. However, the US session will move the dial, with the Federal Reserve in action.

In this article:
It is a quiet morning session for the AUD/USD and NZD/USD. In the early hours, current account figures from New Zealand were in focus.
The numbers delivered Kiwi Dollar support as investors responded further to the US CPI report and considered the Fed interest rate decision and FOMC economic projections.
The New Zealand current account deficit narrowed from NZ$34.39 billion to NZ$33.03 billion in Q1 year-over-year. Economists forecast a deficit of NZ$29.54 billion. However, the deficit narrowed from NZ$10.07 billion to NZ$5.22 billion in the quarter, which was also bullish.
With no economic indicators from Australia or China to consider, sentiment toward the Fed monetary policy decision will influence.
Looking ahead to the US session, it is a busy day on the US economic calendar. US wholesale inflation numbers will draw interest ahead of the Fed policy decision.
Softer-than-expected US wholesale inflation numbers should further ease pressure on the Fed to push interest rates higher.
The US CPI Report impacted market sentiment toward Fed interest rates on Tuesday.
According to the CME FedWatch Tool, bets on the Fed hiking rates by 25 basis points in June and July tumbled in response to the inflation numbers. The probability of a June 25-basis point interest rate hike fell from 20.9% to 4.6%, with the chances of a July 50-basis point interest rate hike falling from 14.0% to 2.9%.
However, the probability of a 25-basis point July hike increased from 59.9% to 60.9%, capping the session gains.
While the inflation numbers will draw interest, the FOMC interest rate decision, economic projections, and press conference will be the focal points. A hawkish pause would weigh on the pairings.
AUD/USD Price Action
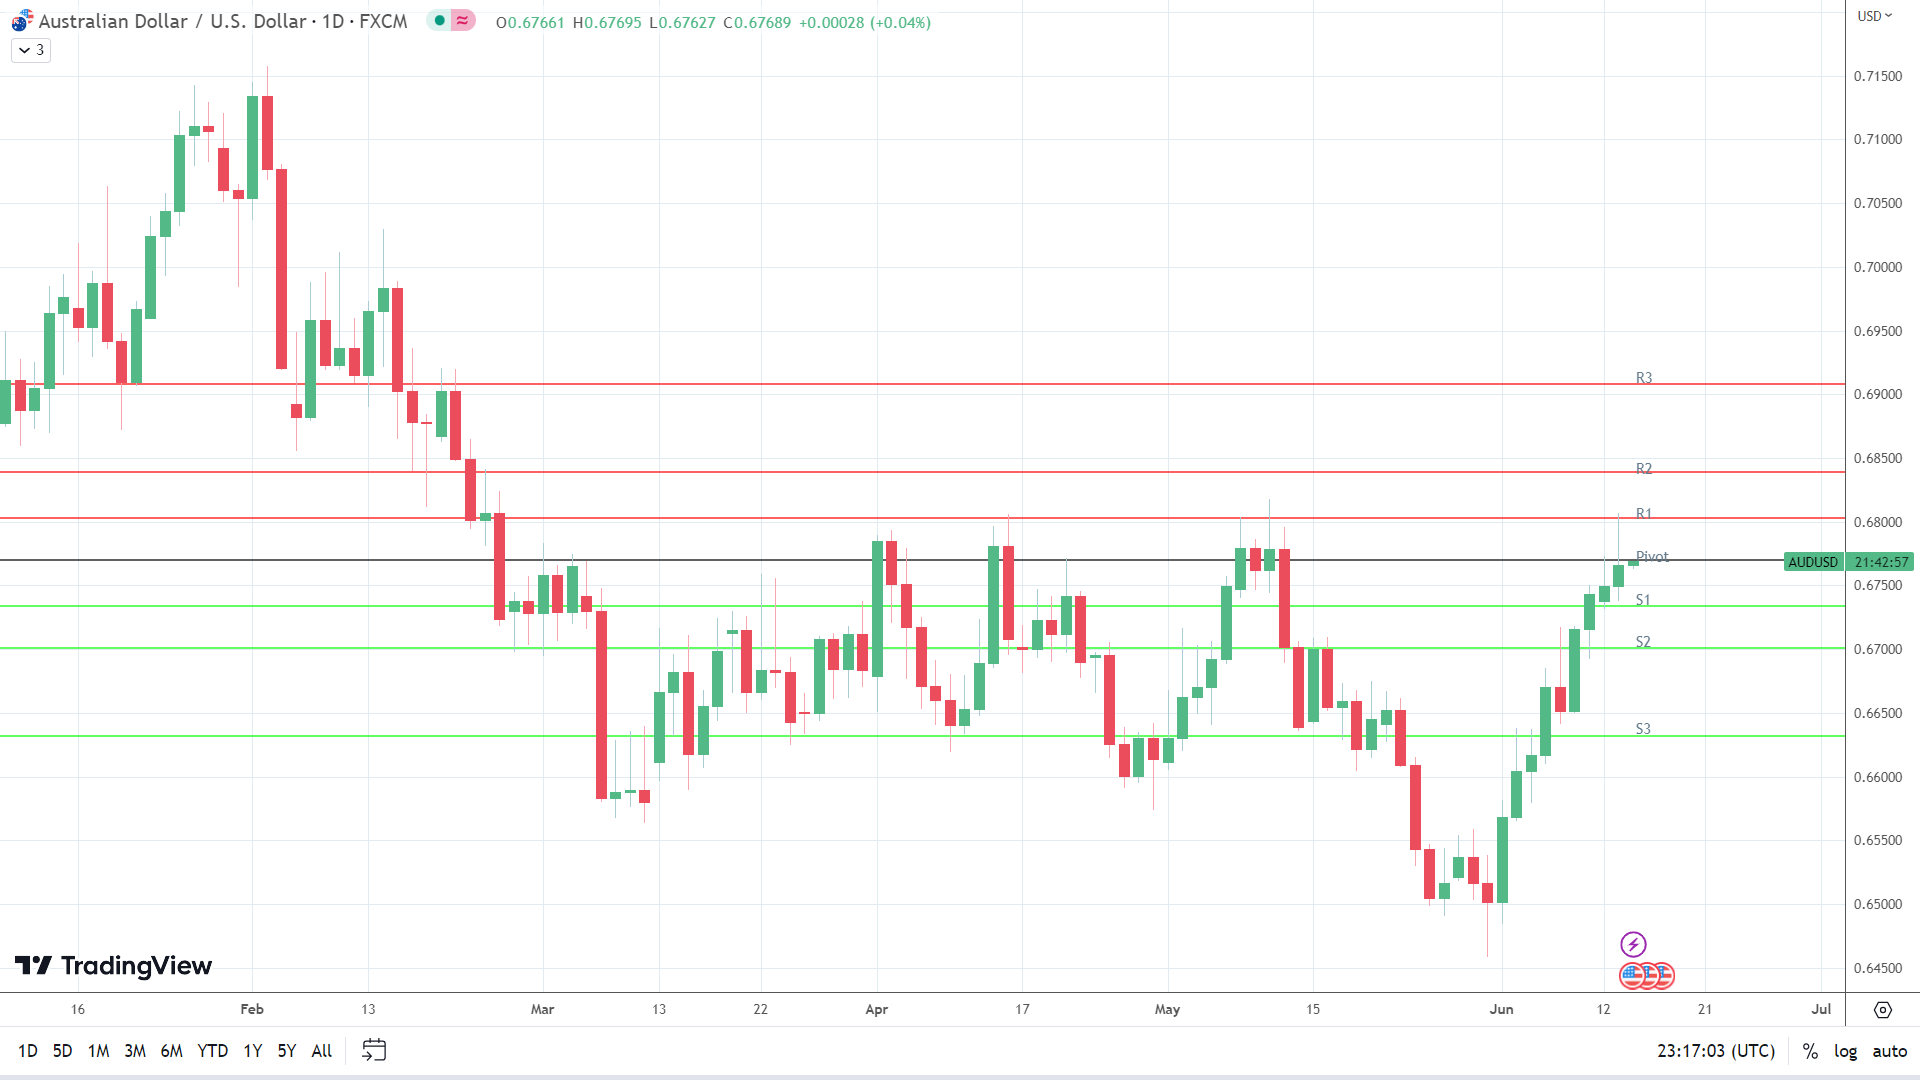
This morning, the AUD/USD was up 0.04% to $0.67689. A mixed start to the day saw the AUD/USD fall to an early low of $0.67627 before rising to a high of $0.67695.
Technical Indicators
Resistance & Support Levels
| R1 – $ | 0.6803 | S1 – $ | 0.6734 |
| R2 – $ | 0.6839 | S2 – $ | 0.6701 |
| R3 – $ | 0.6908 | S3 – $ | 0.6632 |
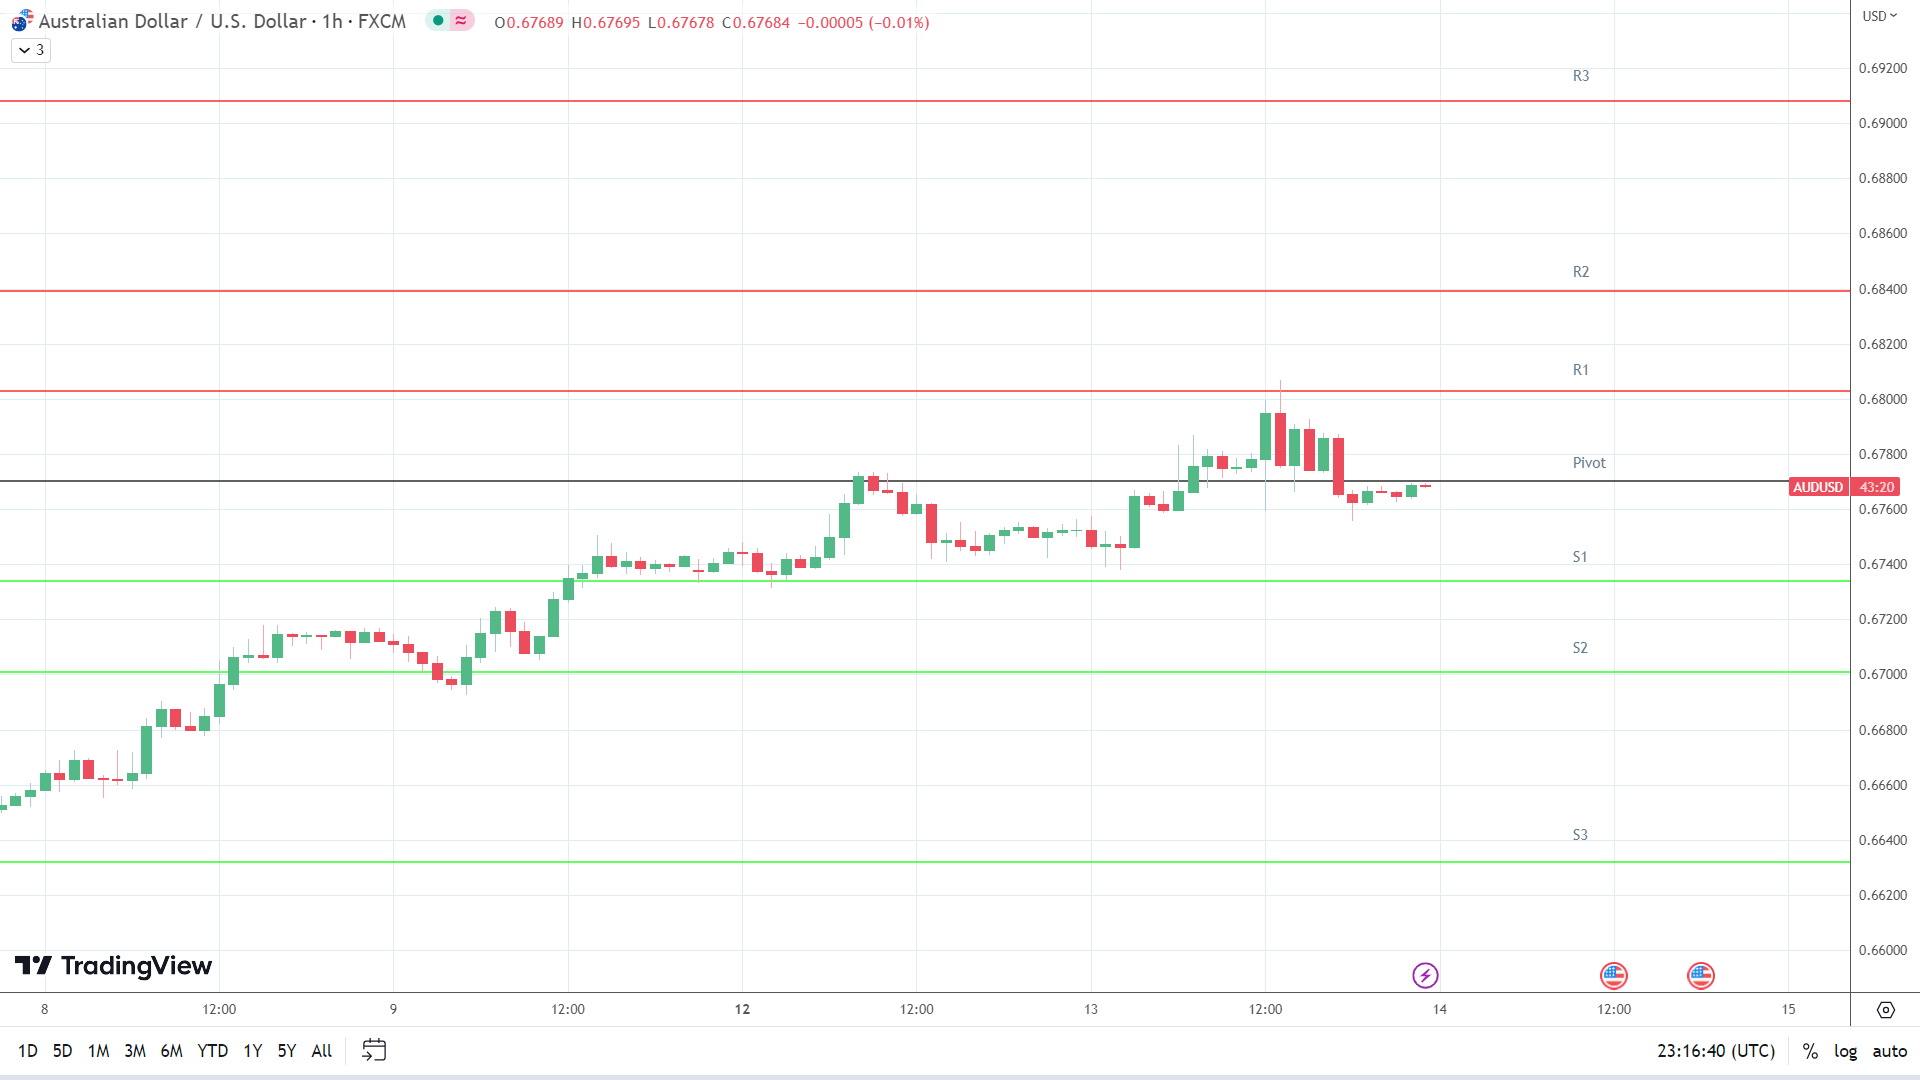
The AUD/USD needs to move through the $0.6770 pivot to target the First Major Resistance Level (R1) at $0.6803 and the Tuesday high of $0.68069. A return to $0.68 would support a breakout. However, the Aussie Dollar would need the Fed to deliver another breakout session.
In case of a breakout session, the Aussie would likely test the Second Major Resistance Level (R2) at $0.6839. The Third Major Resistance Level (R3) sits at $0.6908.
Failure to move through the pivot would leave the First Major Support Level (S1) at $0.6734 in play. However, barring a Fed-fueled sell-off, the AUD/USD pair should avoid the Second Major Support Level (S2) at $0.6701.
The Third Major Support Level (S3) sits at $0.6632.
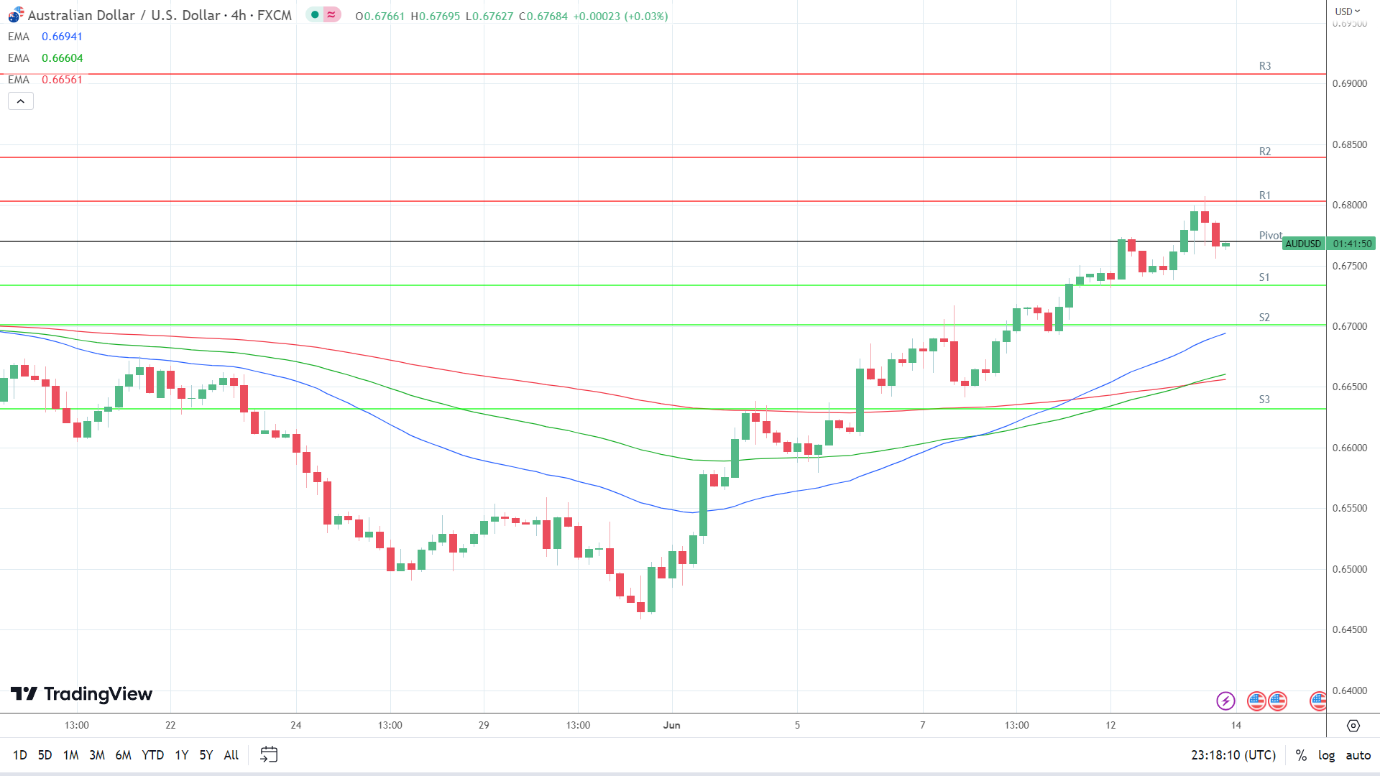
Looking at the EMAs and the 4-hourly chart, the EMAs sent bullish signals. The AUD/USD sat above the 50-day EMA, currently at $0.66941. The 50-day EMA pulled away from the 200-day EMA, with the 100-day EMA crossing through the 200-day EMA, delivering bullish signals.
A hold above the Major Support Levels and the 50-day EMA ($0.66941) would support a breakout from R1 ($0.6803) to give the bulls a run at R2 ($0.6839) and $0.69. However, a fall through S1 ($0.6734) would bring S2 ($0.6701) and the 50-day EMA ($0.66941) into view. An AUD/USD fall through the 50-day EMA would send a bearish signal.
NZD/USD Price Action
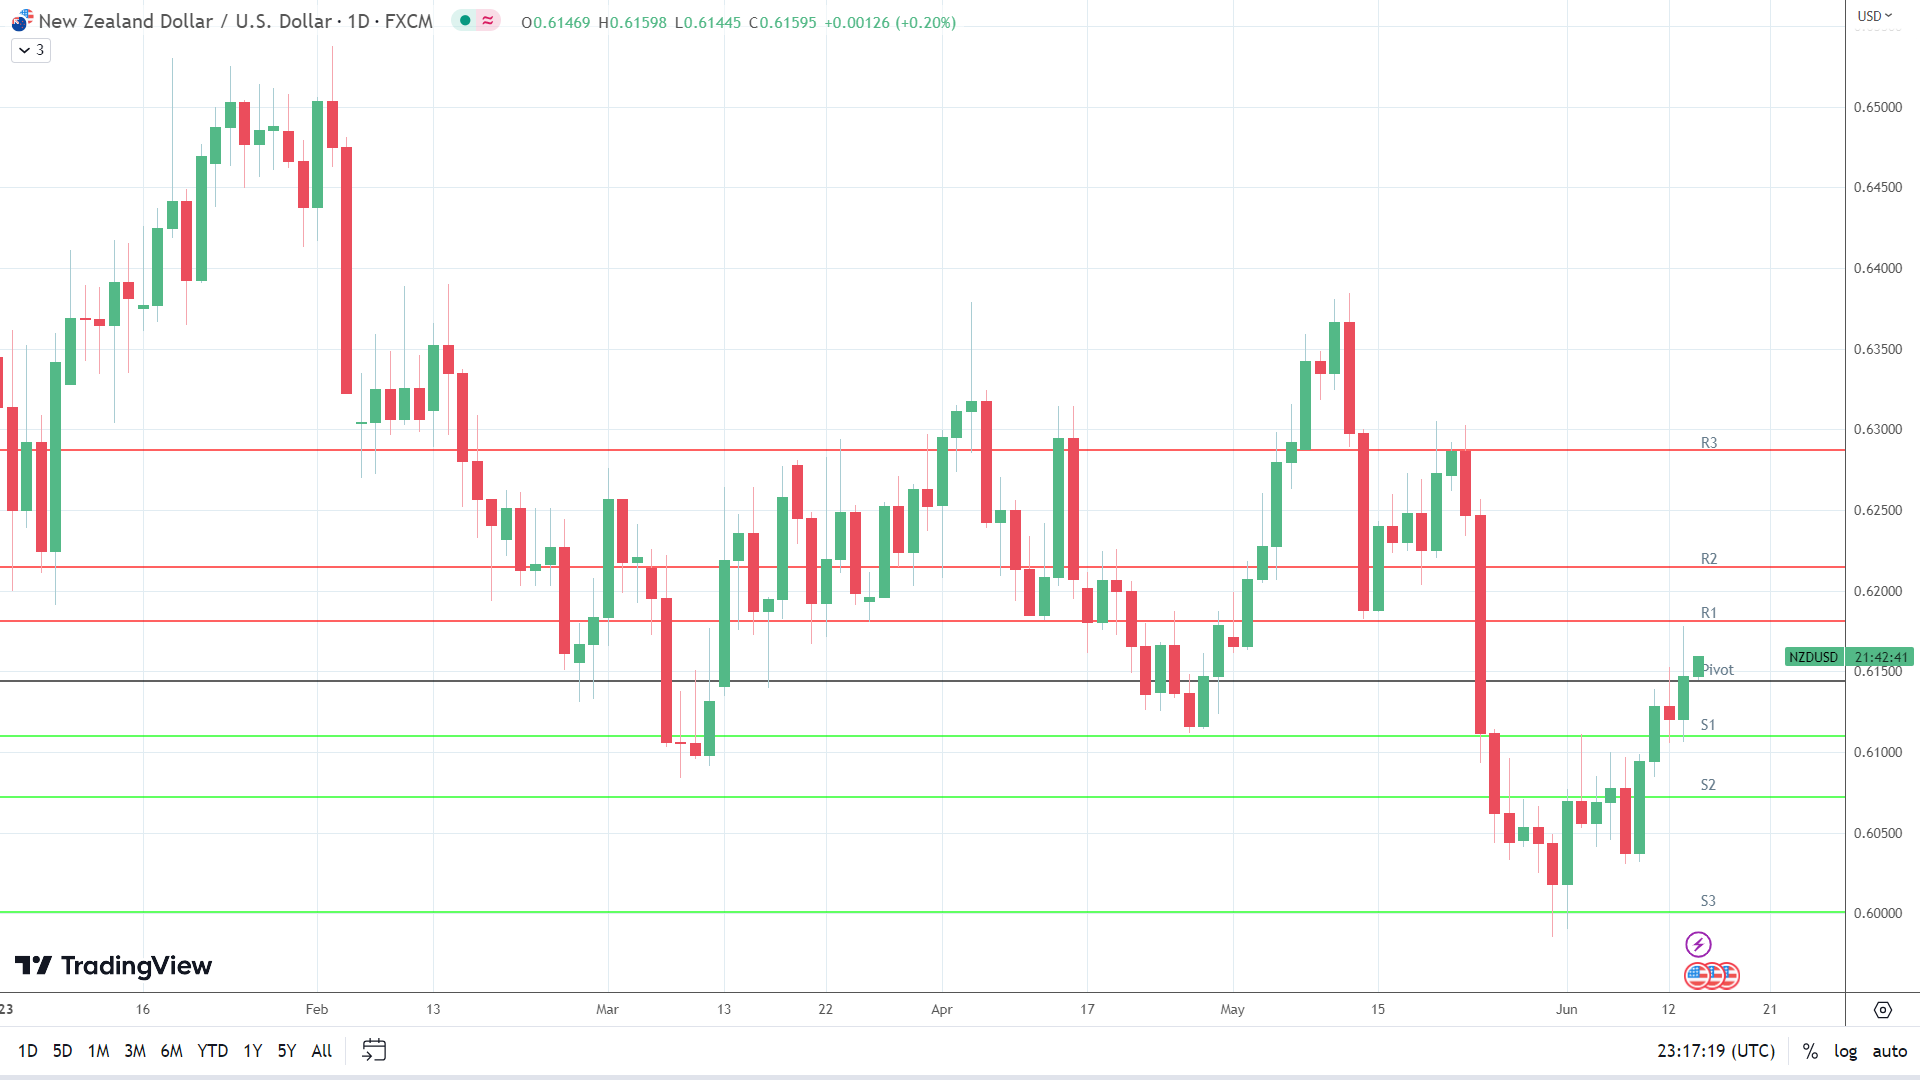
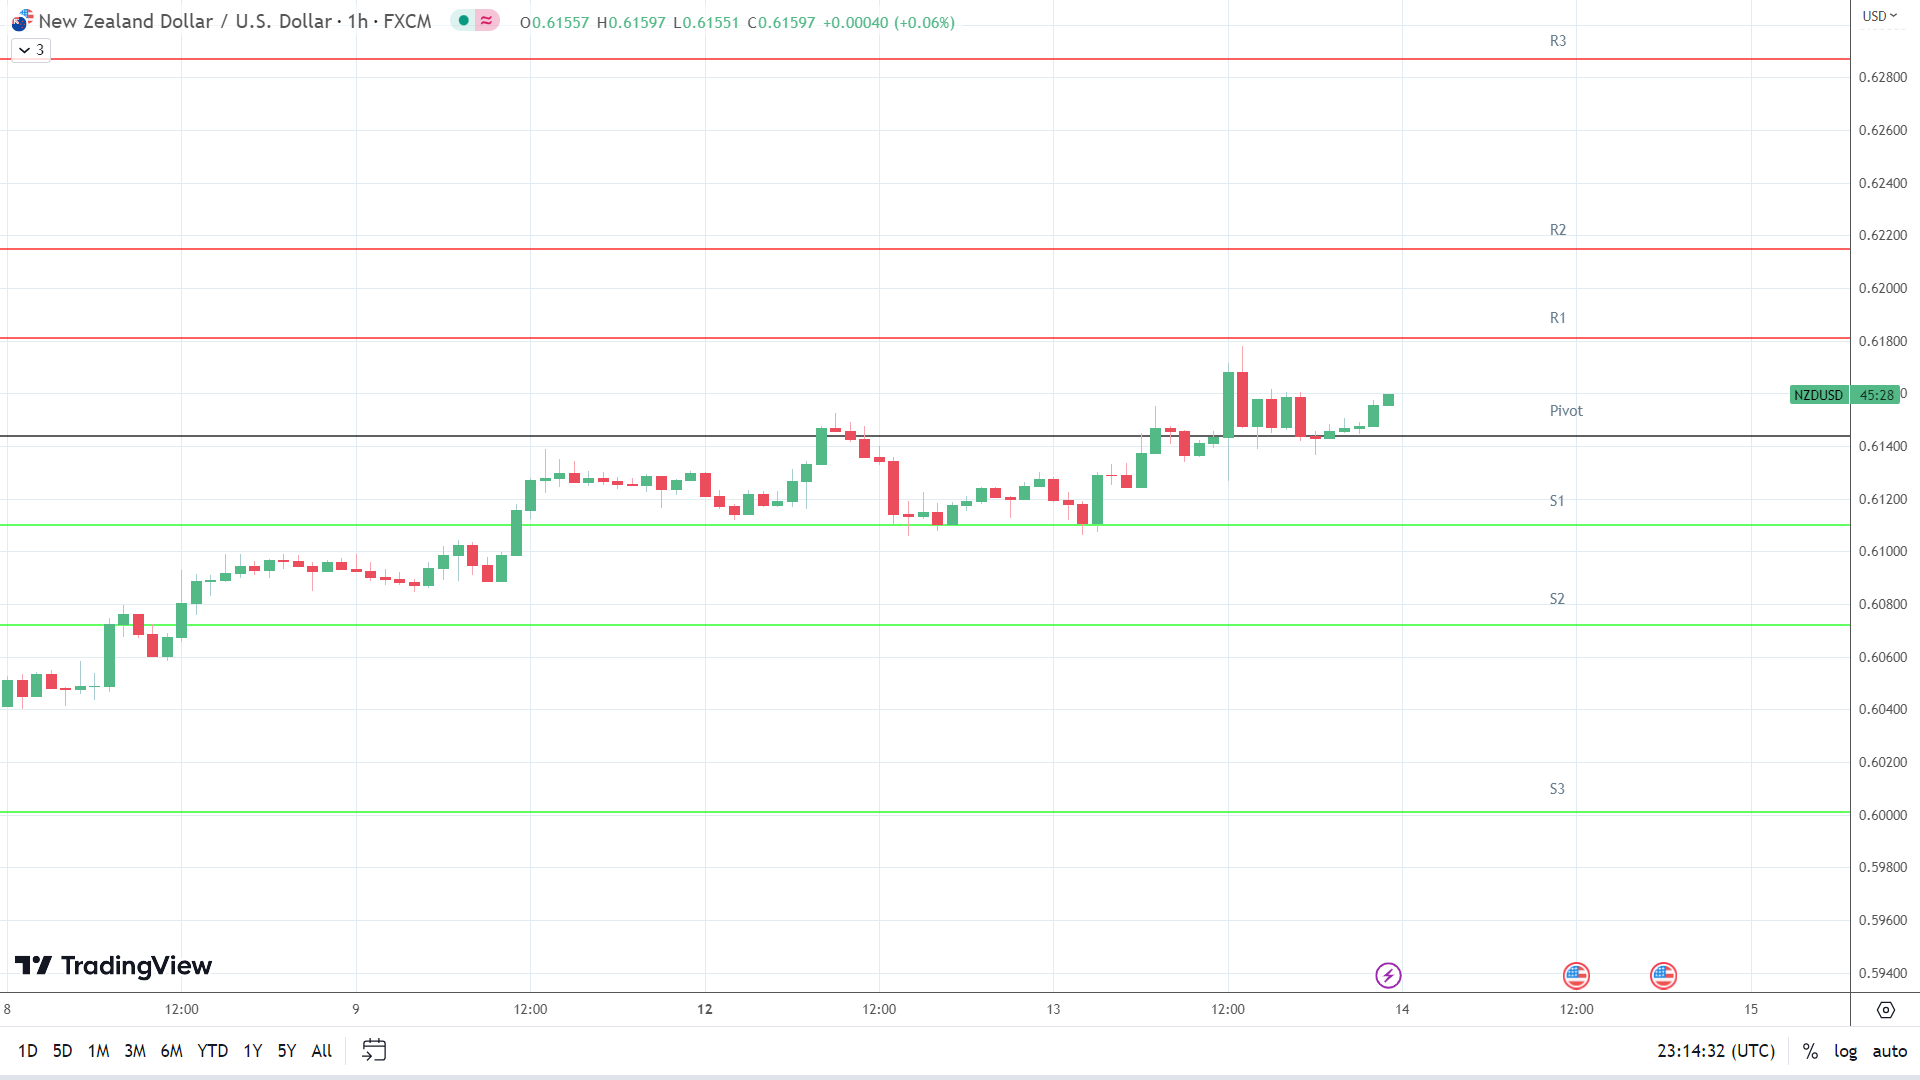
This morning, the NZD/USD was up 0.20% to $0.61595. A mixed start to the day saw the Kiwi fall to an early low of $0.61445 before rising to a high of $0.61598.
Technical Indicators
Resistance & Support Levels
| R1 – $ | 0.6181 | S1 – $ | 0.6110 |
| R2 – $ | 0.6215 | S2 – $ | 0.6072 |
| R3 – $ | 0.6287 | S3 – $ | 0.6001 |
The NZD/USD has to avoid the $0.6144 pivot to target the First Major Resistance Level (R1) at $0.6181. A move through the Tuesday high of $0.61779 would signal a bullish session. However, the Fed has to deliver a dovish pause to support a breakout.
In the case of a breakout session, the Kiwi would likely test the Second Major Resistance Level (R2) at $0.6215. The Third Major Resistance Level (R3) sits at $0.6287.
A fall through the pivot would bring the First Major Support Level (S1) at $0.6110 into play. However, barring a Fed-fueled sell-off, the NZD/USD should steer clear of sub-$0.61 and the Second Major Support Level (S2) at $0.6072.
The Third Major Support Level (S3) sits at $0.6001.
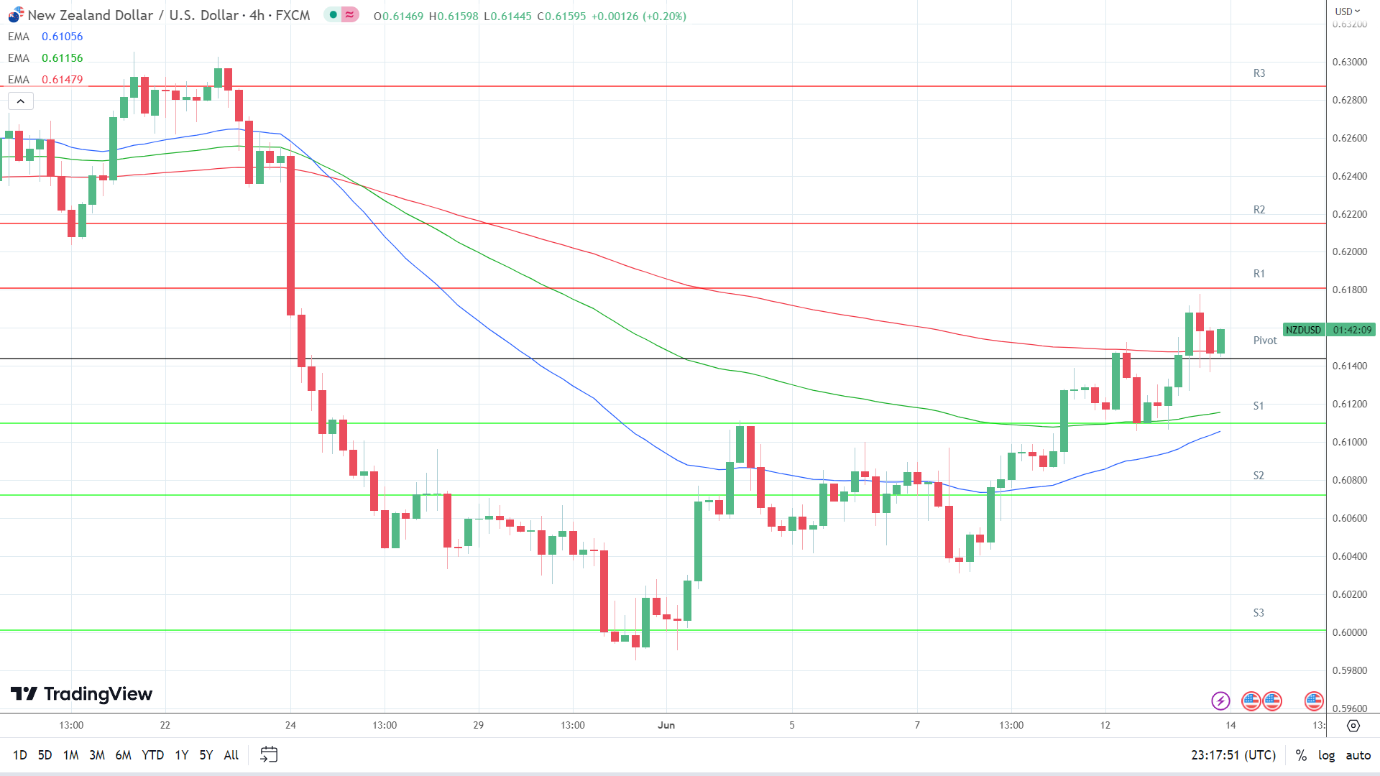
Looking at the EMAs and the 4-hourly chart, the EMAs sent bullish signals. The NZD/USD sat above the 200-day EMA, currently at $0.61479. The 50-day EMA closed in on the 100-day EMA, with the 100-day EMA narrowing to the 200-day EMA, delivering bullish signals.
An NZD/USD hold above the 200-day EMA ($0.61479) would support a breakout from R1 ($0.6181) to give the bulls a run at R2 ($0.6215). However, a fall through the 200-day ($0.61479) and 100-day ($0.61156) EMAs would bring S1 ($0.6110) and the 50-day EMA ($0.61056) into view. A fall through the 50-day EMA would send a bearish signal.
About the Author
Bob Masonauthor
With over 20 years of experience in the finance industry, Bob has been managing regional teams across Europe and Asia and focusing on analytics across both corporate and financial institutions. Currently he is covering developments relating to the financial markets, including currencies, commodities, alternative asset classes, and global equities.
Did you find this article useful?
Latest news and analysis


Advertisement