- AUD/USD holds lower grounds around intraday low while snapping two-day uptrend.
- RSI (14) line’s retreat from overbought territory joins U-turn from 200-EMA to lure Aussie sellers.
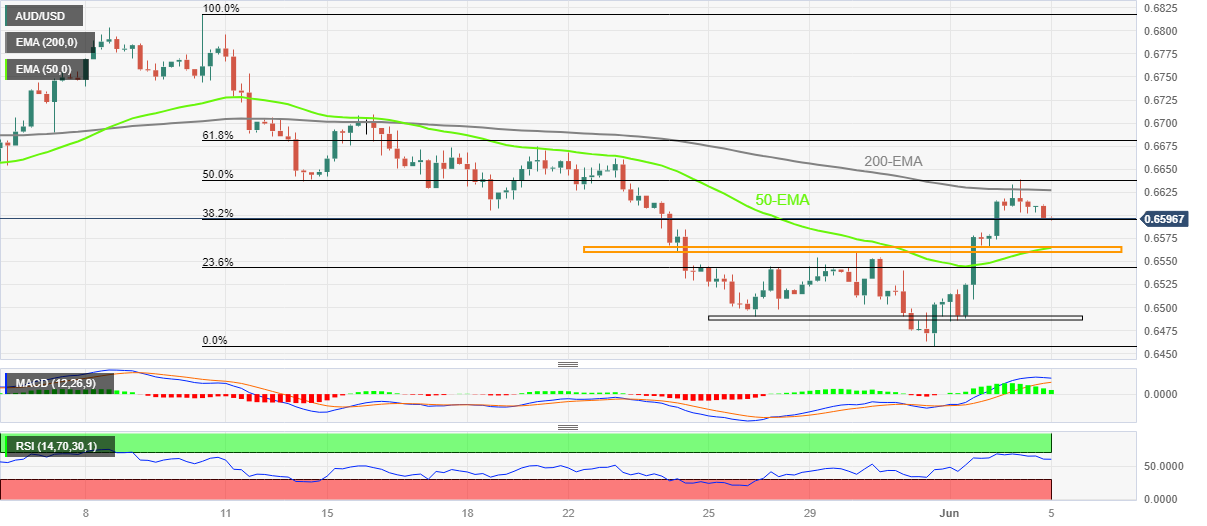
- Convergence of 50-EMA, one-week-old horizontal support zone challenges intraday sellers.
AUD/USD licks its wounds around the intraday low of 0.6595 while printing the first daily loss in three amid Monday’s mid-Asian session. In doing so, the Aussie pair keeps the previous day’s retreat from the 200-bar Exponential Moving Average (EMA).
Adding strength to the downside bias is the RSI (14) line’s U-turn from the overbought territory, as well as the receding bullish bias of the MACD indicator.
However, a convergence of the 50-EMA and multiple levels marked since May 24, around 0.6565-60, appears a tough nut to crack for the AUD/USD bears.
In a case where the Aussie pair drops below 0.6560, a quick drop towards another key horizontal support zone surrounding 0.6490, comprising levels marked in the last week, can’t be ruled out.
It’s worth observing though that the AUD/USD pair’s weakness past 0.6490 needs validation from the previous monthly low of around 0.6460 to keep the bears on board.
On the contrary, AUD/USD recovery remains elusive below the 200-EMA hurdle surrounding 0.6630.
Also acting as upside filters are 50% and 61.8% Fibonacci retracements of the pair’s May 10-31 downside, respectively near 0.6640 and 0.6680.
Overall, AUD/USD remains on the back foot but the downside room appears limited.
AUD/USD: Four-hour chart
Trend: Limited downside expected
Information on these pages contains forward-looking statements that involve risks and uncertainties. Markets and instruments profiled on this page are for informational purposes only and should not in any way come across as a recommendation to buy or sell in these assets. You should do your own thorough research before making any investment decisions. FXStreet does not in any way guarantee that this information is free from mistakes, errors, or material misstatements. It also does not guarantee that this information is of a timely nature. Investing in Open Markets involves a great deal of risk, including the loss of all or a portion of your investment, as well as emotional distress. All risks, losses and costs associated with investing, including total loss of principal, are your responsibility. The views and opinions expressed in this article are those of the authors and do not necessarily reflect the official policy or position of FXStreet nor its advertisers. The author will not be held responsible for information that is found at the end of links posted on this page.
If not otherwise explicitly mentioned in the body of the article, at the time of writing, the author has no position in any stock mentioned in this article and no business relationship with any company mentioned. The author has not received compensation for writing this article, other than from FXStreet.
FXStreet and the author do not provide personalized recommendations. The author makes no representations as to the accuracy, completeness, or suitability of this information. FXStreet and the author will not be liable for any errors, omissions or any losses, injuries or damages arising from this information and its display or use. Errors and omissions excepted.
The author and FXStreet are not registered investment advisors and nothing in this article is intended to be investment advice.
Recommended content
Editors’ Picks
EUR/USD holds above 1.0700 ahead of US jobs report

EUR/USD stays in a consolidation phase above 1.0700 after closing the previous two days in positive territory. Investors eagerly await April jobs report from the US, which will include Nonfarm Payrolls and Unemployment Rate readings.
GBP/USD advances to 1.2550, all eyes on US NFP data

The GBP/USD pair trades on a stronger note around 1.2550 amid the softer US Dollar on Friday. Market participants refrain from taking large positions as focus shifts to April Nonfarm Payrolls and ISM Services PMI data from the US.
Gold remains stuck near $2,300 ahead of US NFP

Gold price struggles to gain any meaningful traction and trades in a tight channel near $2,300. The Fed’s less hawkish outlook drags the USD to a multi-week low and lends support to XAU/USD ahead of the key US NFP data.
XRP edges up after week-long decline as Ripple files letter in reply to SEC’s motion

Ripple filed a letter to the court to support its April 22 motion to strike new expert materials. The legal clash concerns whether SEC accountant Andrea Fox's testimony should be treated as a summary or expert witness.
US NFP Forecast: Nonfarm Payrolls gains expected to cool in April

The NFP report is expected to show that the US economy added 243,000 jobs last month, sharply lower than the 303,000 job creation seen in March. The Unemployment Rate is set to stay unchanged at 3.8% in the same period.