
Advertisement
Advertisement
USD/JPY and 140.5 in the Hands of US Stats and Debt Ceiling Talks
By:
It is a quiet start for the USD/JPY, with no stats to consider this morning. However, US GDP and jobless claims and debt ceiling talks will move the dial.

In this article:
It is another quiet start to the day for the USD/JPY. There are no major economic indicators from Japan to draw interest this morning. The lack of stats will leave market sentiment toward monetary policy and the debt ceiling crisis to provide direction.
FOMC members appeared uncertain about peak interest rates despite ongoing worries about inflation. However, FOMC members were also concerned about the debt ceiling, which likely contributed to the policy uncertainty.
With the Fed in limbo and the markets facing an increased threat of a US default, the USD/JPY took an early tumble this morning.
USD/JPY Price Action
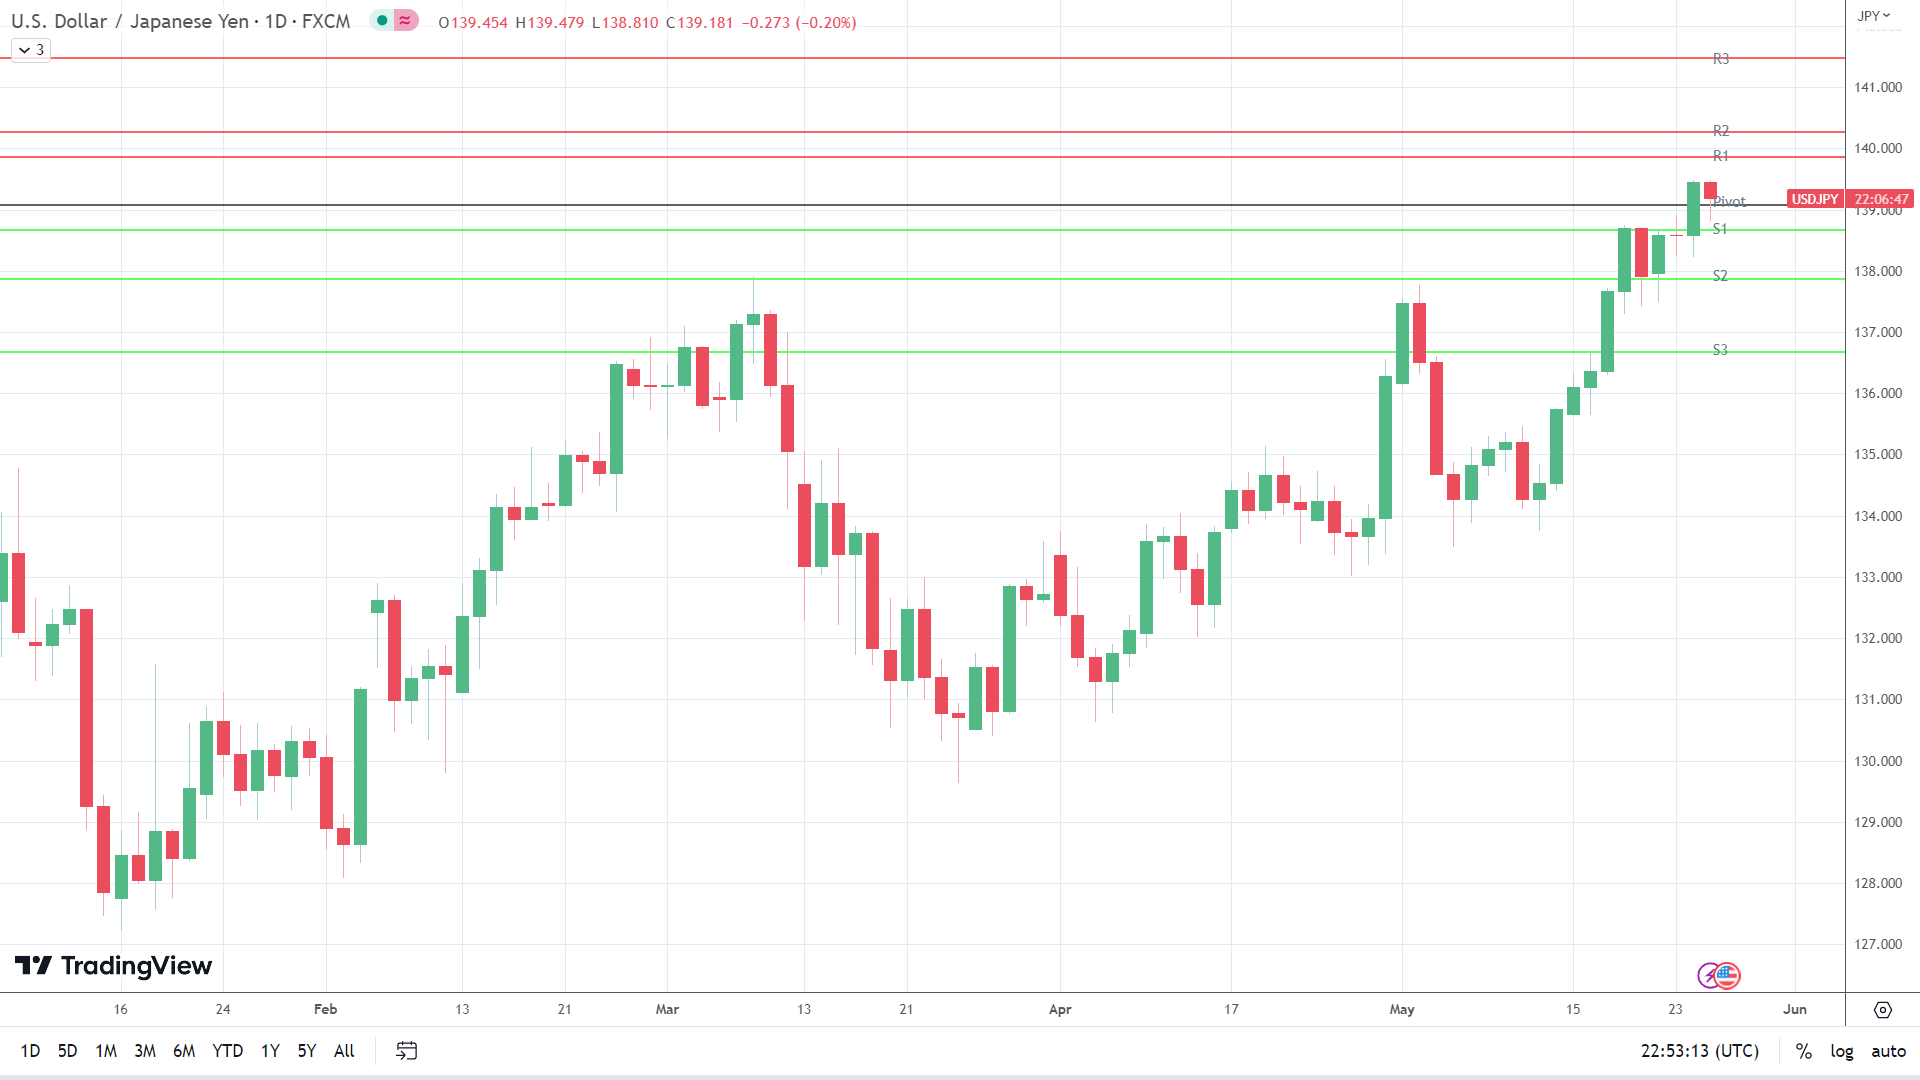
This morning, the USD/JPY was down 0.20% to 139.181. A mixed start to the day saw the USD/JPY rise to an early high of 139.479 before sliding to a low of 138.810.
Technical Indicators
Resistance & Support Levels
| R1 – ¥ | 139.8617 | S1 – ¥ | 138.6617 |
| R2 – ¥ | 140.2693 | S2 – ¥ | 137.8693 |
| R3 – ¥ | 141.4693 | S3 – ¥ | 136.6693 |
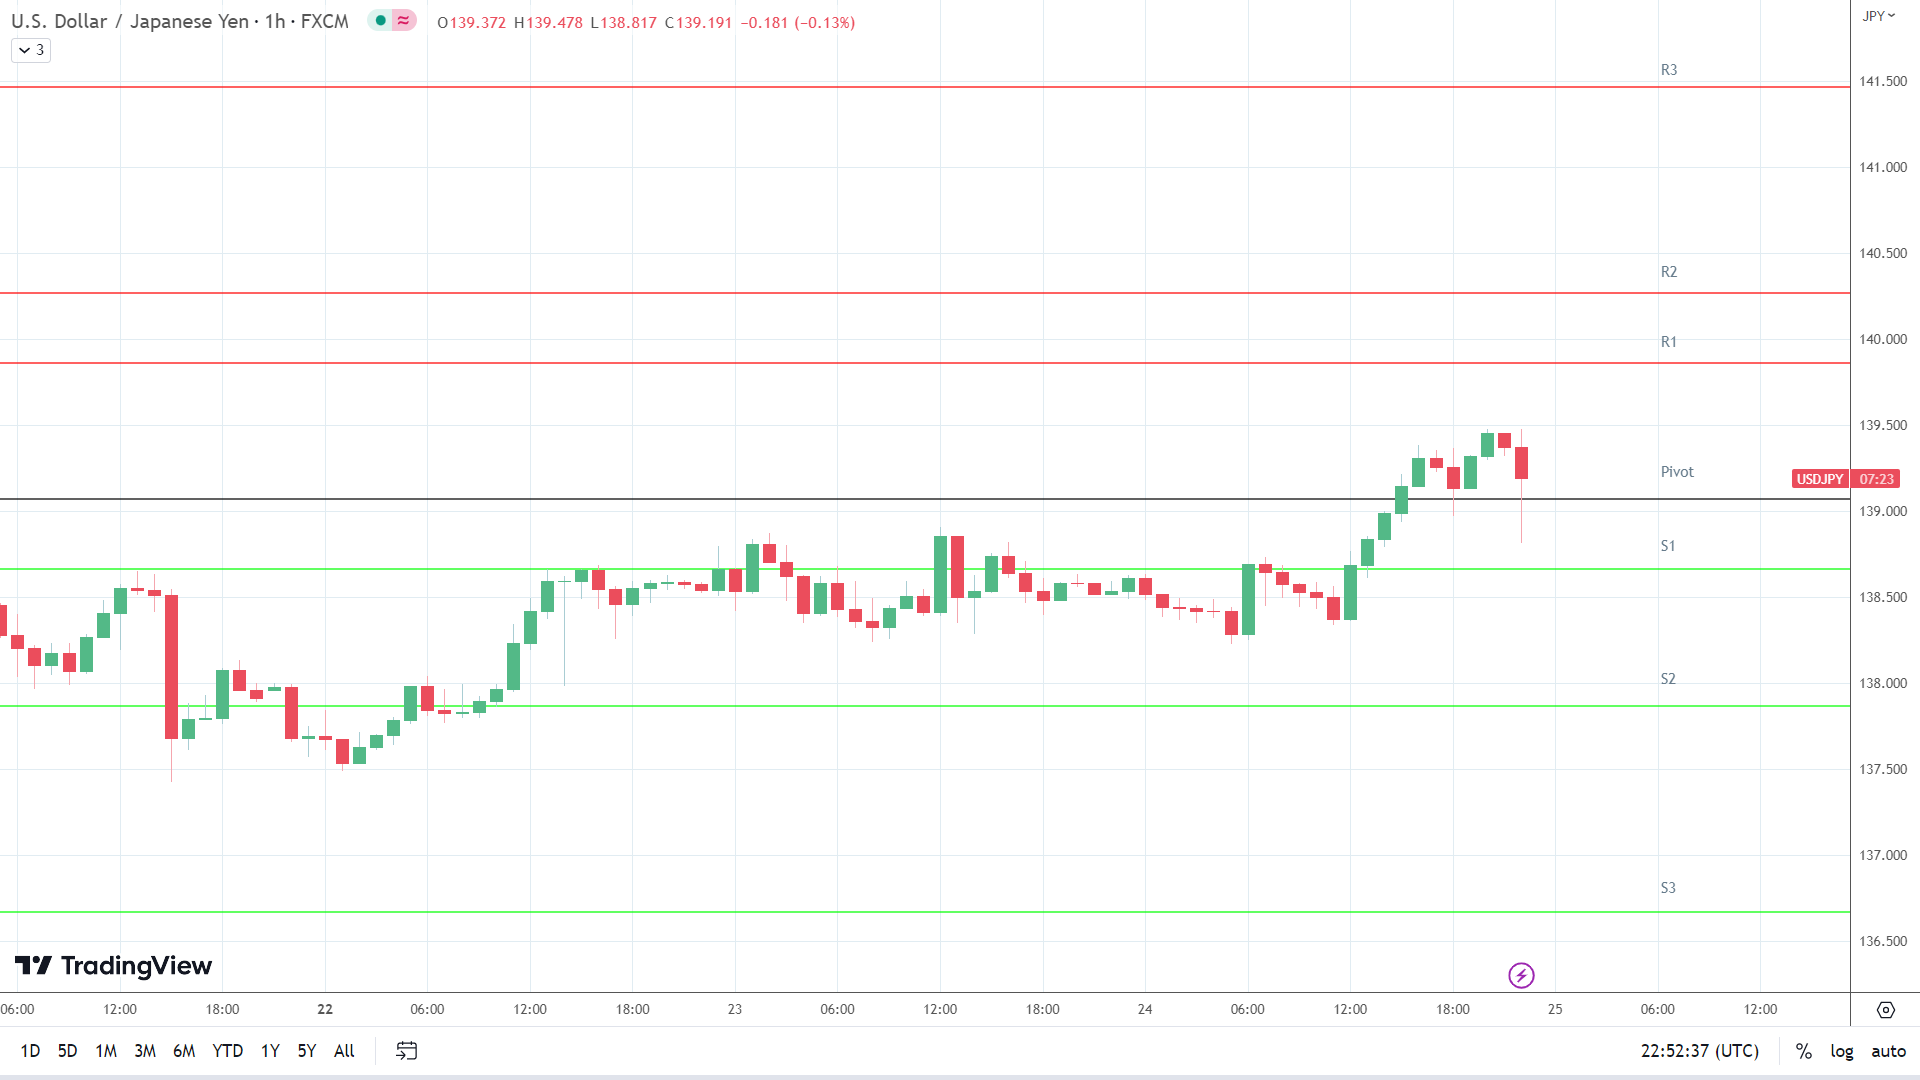
The USD/JPY needs to avoid the 139.069 pivot to target the First Major Resistance Level (R1) at 139.862. A move through the morning high of 139.479 would signal a bullish USD/JPY session. However, US stats and debt ceiling news must support a USD/JPY breakout.
In case of an extended rally, the bulls would likely test the Second Major Resistance Level (R2) at 140.269 and resistance at 140.5. The Third Major Resistance Level (R3) sits at 141.469.
A fall through the pivot would bring the First Major Support Level (S1) at 138.662 into play. However, barring a risk-off fueled sell-off, the USD/JPY pair should avoid sub-138 and the Second Major Support Level (S2) at 137.869. The Third Major Support Level (S3) sits at 136.669.
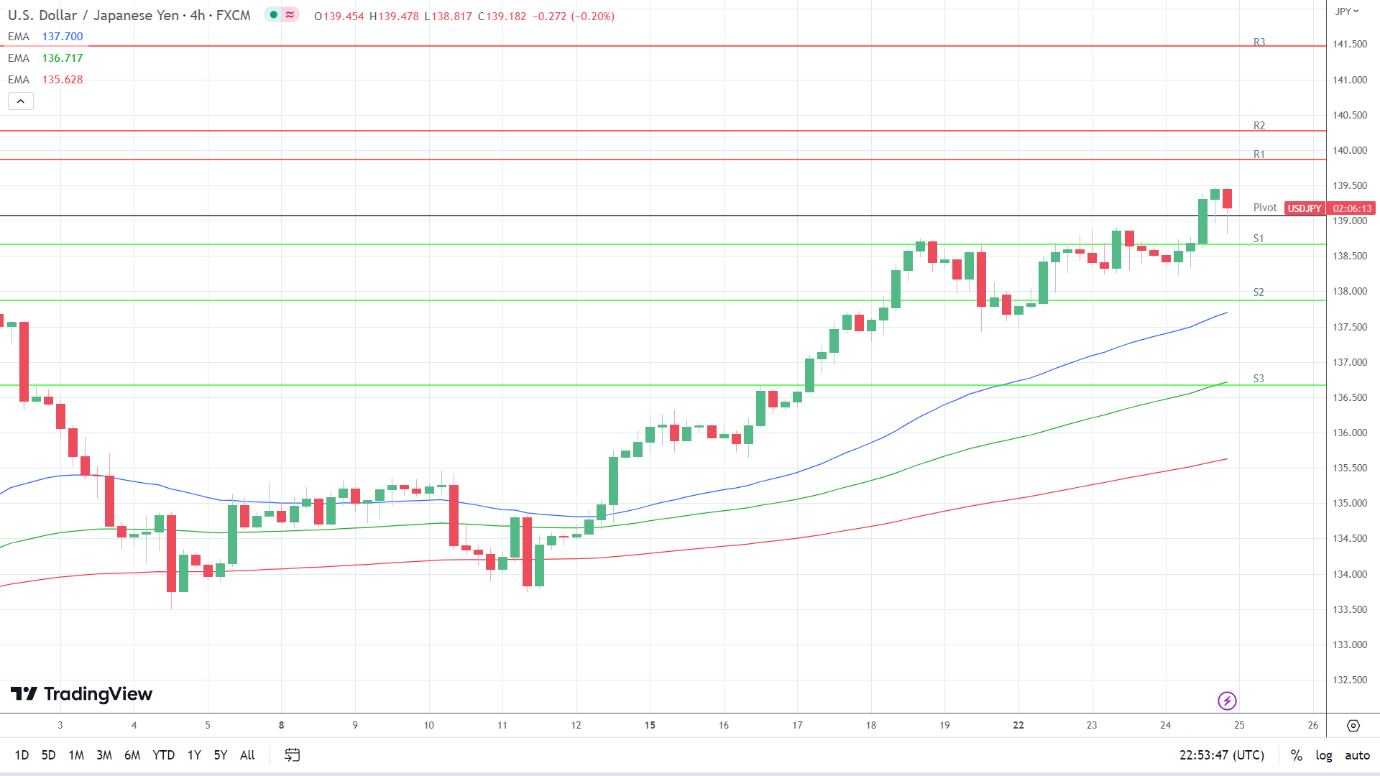
Looking at the EMAs and the 4-hourly chart, the EMAs send bullish signals. The USD/JPY sits above the 50-day EMA (137.700). The 50-day pulled further away from the 100-day EMA, with the 100-day EMA widening from the 200-day EMA, delivering bullish signals.
A USD/JPY hold above the Major Support Levels and 50-day EMA (137.700) would support a breakout from R1 (139.862) to target R2 (140.269) and 140.5. However, a fall through the S1 (138.662) would bring S2 (137.869) and the 50-day EMA (137.700) into view. A USD/JPY fall through the 50-day EMA would send a bearish signal.
The US Session
Looking ahead to the US session, it is a busier day on the US economic calendar. US jobless claims, second estimate GDP numbers for Q1, and pending home sales figures for April will be in focus.
We expect the jobless claims and GDP numbers to have more impact on the USD/JPY pair. An unexpected fall in initial jobless claims and an upward revision to GDP estimates would fuel bets on a June rate hike.
However, the FOMC chatter and US debt ceiling-related news also need consideration.
According to the CME FedWatch Tool, the probability of a 25-basis point Fed interest rate hike in June stood at 36.4%, up from 28.1% on Tuesday. The FOMC meeting minutes did not write off a June interest rate hike, with concerns over inflation raising bets on a June move.
About the Author
Bob Masonauthor
With over 20 years of experience in the finance industry, Bob has been managing regional teams across Europe and Asia and focusing on analytics across both corporate and financial institutions. Currently he is covering developments relating to the financial markets, including currencies, commodities, alternative asset classes, and global equities.
Did you find this article useful?
Latest news and analysis


Advertisement