- EUR/USD drops to the lowest levels since late March, down for the third consecutive day.
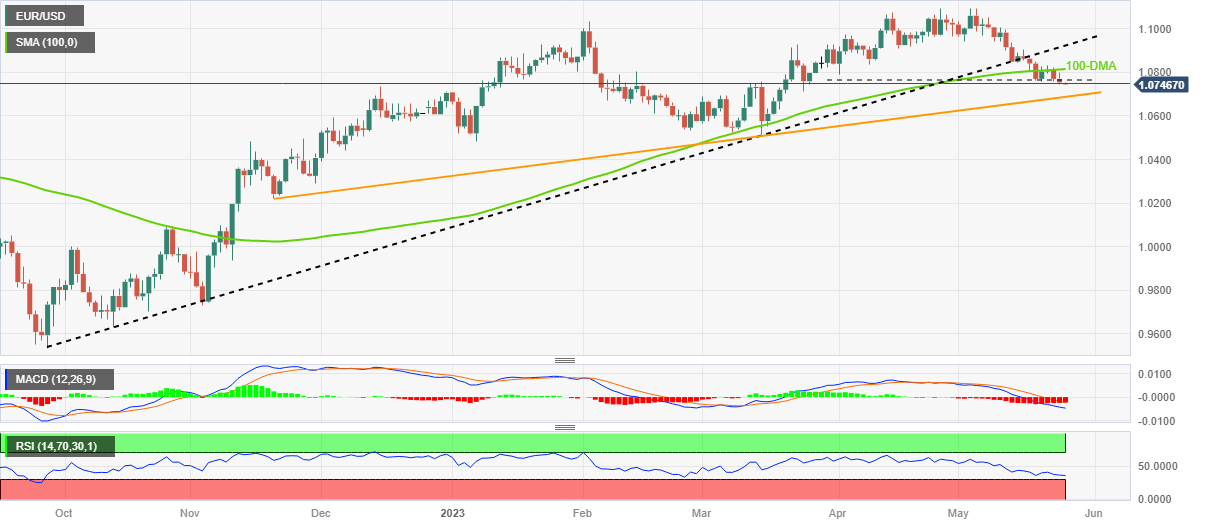
- Clear reversal from 100-DMA hurdle, downside break of previous weekly bottom joins bearish MACD signals to favor Euro bears.
- Downbeat RSI conditions suggest limited room towards the south, highlighting six-month-old ascending support line.
EUR/USD holds lower grounds as bears prod the 1.0750 mark after falling to the fresh low since late March during early Thursday in Asia. In doing so, the Euro pair drops for the third consecutive day while slipping beneath the weekly low, as well as the two-month bottom marked the last week.
It should be noted that the Euro pair’s U-turn from the 100-DMA hurdle and bearish MACD signals add strength to the bearish bias. However, the RSI (14) line is nearly oversold and hence suggests limited downside room before the next leg of the south run.
As a result, the EUR/USD bears are well set to break the 1.0750 support and approach the 1.0700 round figure. However, an upward-sloping support line from late November 2022, close to 1.0690 by the pres time, gains the market’s attention.
In a case where the Euro pair breaks the aforementioned support line, the odds of witnessing a slump toward March’s low of 1.0515 and then toward the yearly low marked in January near 1.0480 can’t be ruled out.
On the other hand, a daily closing beyond the 100-DMA level of 1.0815 isn’t an open welcome for the EUR/USD bulls as the previous support line from September 2022, around 1.0920 at the latest, holds the key for the buyer’s entry.
Following that, the 1.1000 psychological magnet may act as an extra barrier for the Euro buyers targeting further upside of the pair.
EUR/USD: Daily chart
Trend: Limited downside expected
Information on these pages contains forward-looking statements that involve risks and uncertainties. Markets and instruments profiled on this page are for informational purposes only and should not in any way come across as a recommendation to buy or sell in these assets. You should do your own thorough research before making any investment decisions. FXStreet does not in any way guarantee that this information is free from mistakes, errors, or material misstatements. It also does not guarantee that this information is of a timely nature. Investing in Open Markets involves a great deal of risk, including the loss of all or a portion of your investment, as well as emotional distress. All risks, losses and costs associated with investing, including total loss of principal, are your responsibility. The views and opinions expressed in this article are those of the authors and do not necessarily reflect the official policy or position of FXStreet nor its advertisers. The author will not be held responsible for information that is found at the end of links posted on this page.
If not otherwise explicitly mentioned in the body of the article, at the time of writing, the author has no position in any stock mentioned in this article and no business relationship with any company mentioned. The author has not received compensation for writing this article, other than from FXStreet.
FXStreet and the author do not provide personalized recommendations. The author makes no representations as to the accuracy, completeness, or suitability of this information. FXStreet and the author will not be liable for any errors, omissions or any losses, injuries or damages arising from this information and its display or use. Errors and omissions excepted.
The author and FXStreet are not registered investment advisors and nothing in this article is intended to be investment advice.
Recommended content
Editors’ Picks
AUD/USD sits at weekly lows near 0.6600 amid mixed market mood

AUD/USD is sitting at weekly lows just above 0.6600 in the Asian session on Thursday. Mixed Australian PMIs and cautious markets keep the pair undermined. The Aussie registered losses on Wednesday after the Fed Minutes hinted at raising rates if inflation warranted it.
USD/JPY pulls back from near 157.00 as US Dollar struggles

USD/JPY is reversing a fresh uptick to two-week highs near 157.00 in Asian trading on Thursday. The pair briefly tested the 157.00 threshold on BoJ's steady bond-buying operation. However, a pause in the US Dollar rebound and sluggish US Treasury bond yields drag the pair lower.
Gold price edges lower on Fed's hawkish stance

Gold price extends the decline on Wednesday. The further upside of the yellow metal might be limited, as the FOMC minutes were interpreted as significantly more hawkish than previous releases. The cautious approach of the US Fed to hold its restrictive policy for longer boosts the Greenback broadly.
NEAR protocol could see a rally as it sets out to launch an AI smart contract builder
Near protocol co-founder Illia Polosukhin stated in a social media post on Wednesday plans for NEAR to launch NEAR AI, a user-owned AI system that will allow users to build web3 apps without code on an end-to-end network.
Nvidia Q1 earnings push NVDA stock to new all-time high Premium

Nvidia earnings were a smash hit once again when they arrived after Wednesday's market close. Shares blasted past the former $974 all-time high to reach just under $1,000 per share, up more than 4% afterhours.