
Advertisement
Advertisement
AUD/USD and NZD/USD Fundamental Analysis: US Debt Crisis Eyed
By:
It is a quiet start to the week for the AUD/USD and NZD/USD. A lack of economic indicators will leave US debt ceiling news to influence early.

In this article:
It is a quiet start to the day for the AUD/USD and NZD/USD. There are no Australian or New Zealand economic indicators for investors to consider.
The lack of stats will leave the Aussie and Kiwi in the hands of market risk sentiment. A bearish end to last week delivered the pairs with heavy losses. The US debt crisis and the increasing threat of a global recession weighed on riskier assets.
This morning, US debt ceiling-related news will influence ahead of the US session.
Later today, NY Empire State Manufacturing Index numbers for May will be in focus. Economists forecast a fall from 10.8 to -2.5, which would be bearish.
FOMC member commentary will also draw interest, with members Kashkari, Bostic, and Barkin speaking today.
AUD/USD Price Action
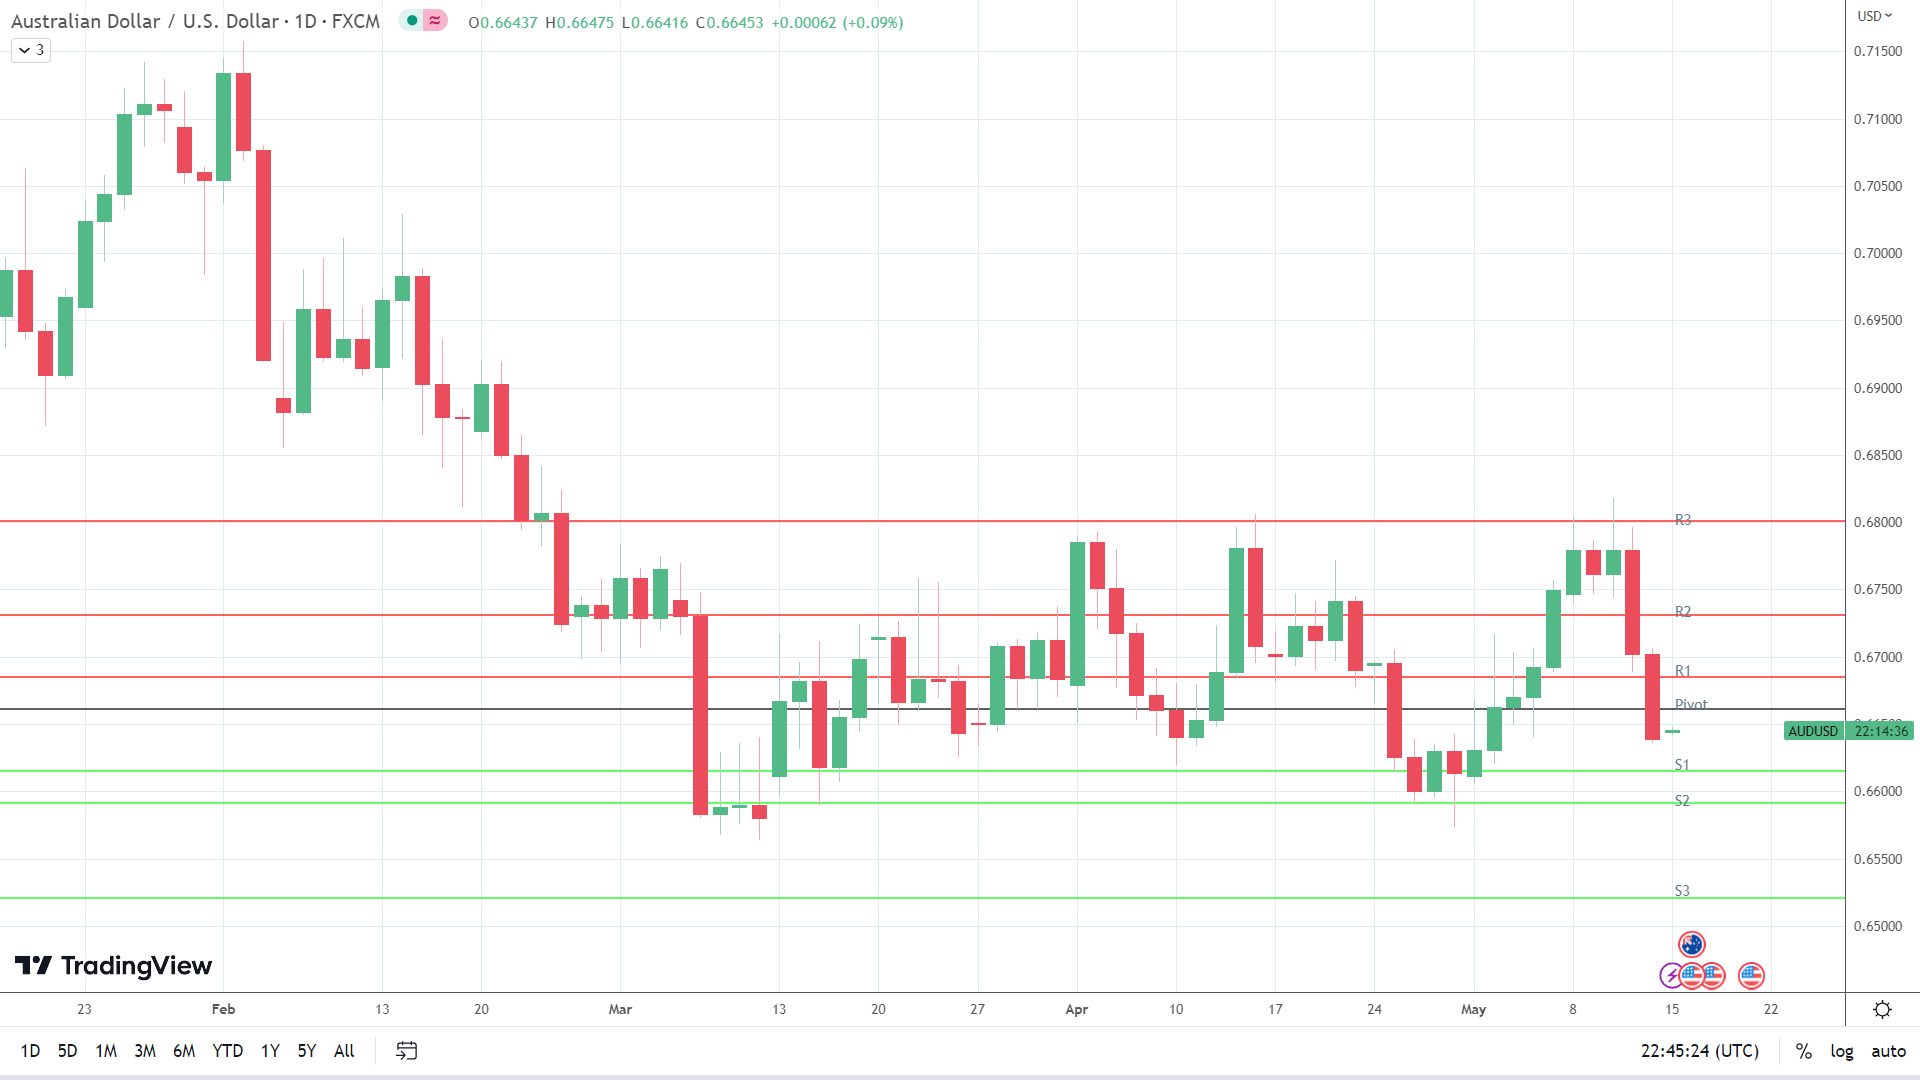
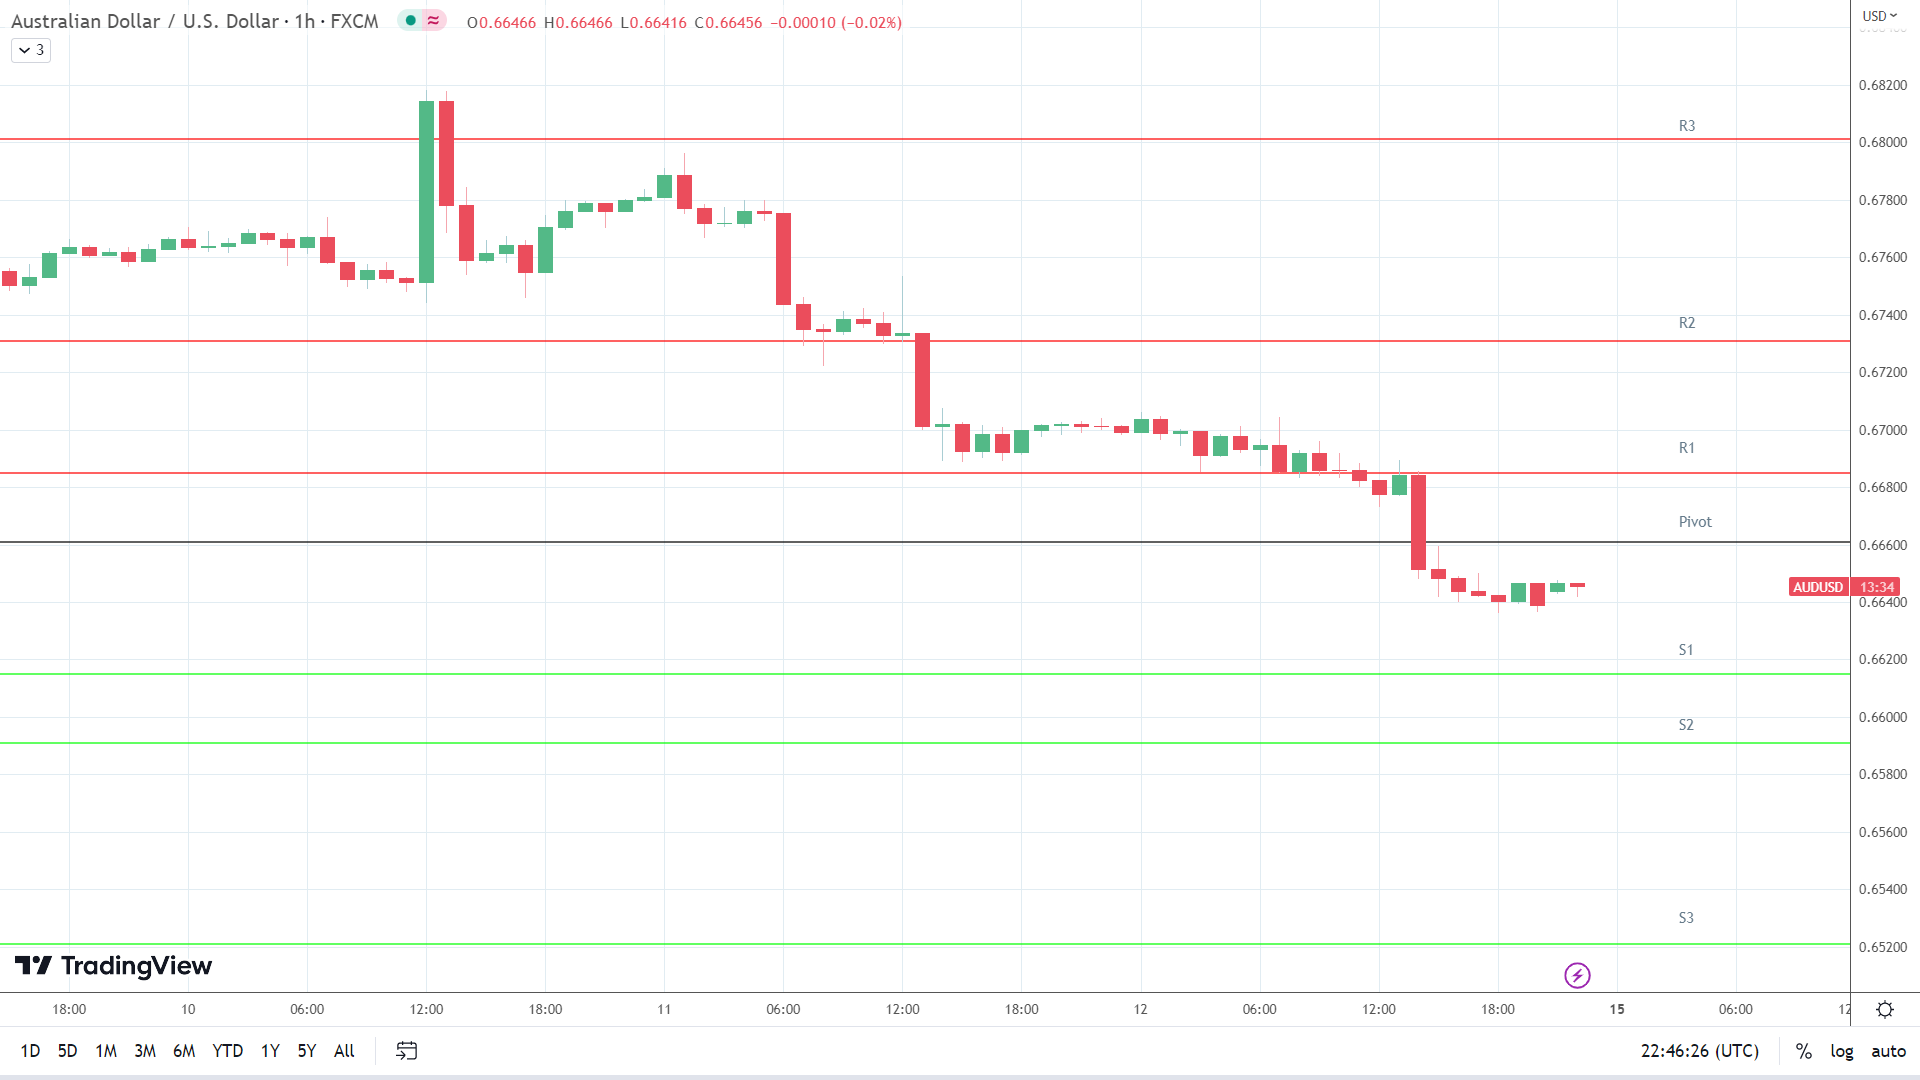
This morning, the AUD/USD was up 0.09% to $0.66453. A mixed start to the day saw the AUD/USD rise to an early high of $0.66475 before falling to a low of $0.66416.
Technical Indicators
Resistance & Support Levels
| R1 – $ | 0.6685 | S1 – $ | 0.6615 |
| R2 – $ | 0.6731 | S2 – $ | 0.6591 |
| R3 – $ | 0.6801 | S3 – $ | 0.6521 |
The AUD/USD needs to move through the $0.6661 pivot to target the First Major Resistance Level (R1) at $0.6685. A return to $0.6650 would signal a bullish session. However, the Aussie would need central bank chatter and debt ceiling news to support a breakout.
In case of a breakout session, the Aussie would likely test resistance at the Friday high of $0.67062 but fall short of the Second Major Resistance Level (R2) at $0.6731. The Third Major Resistance Level (R3) sits at $0.6801.
Failure to move through the pivot would leave the First Major Support Level (S1) at $0.6615 in play. However, barring a US debt ceiling-fueled sell-off, the AUD/USD pair should avoid sub $0.66 and the Second Major Support Level (S2) at $0.6591.
The Third Major Support Level (S3) sits at $0.6521.
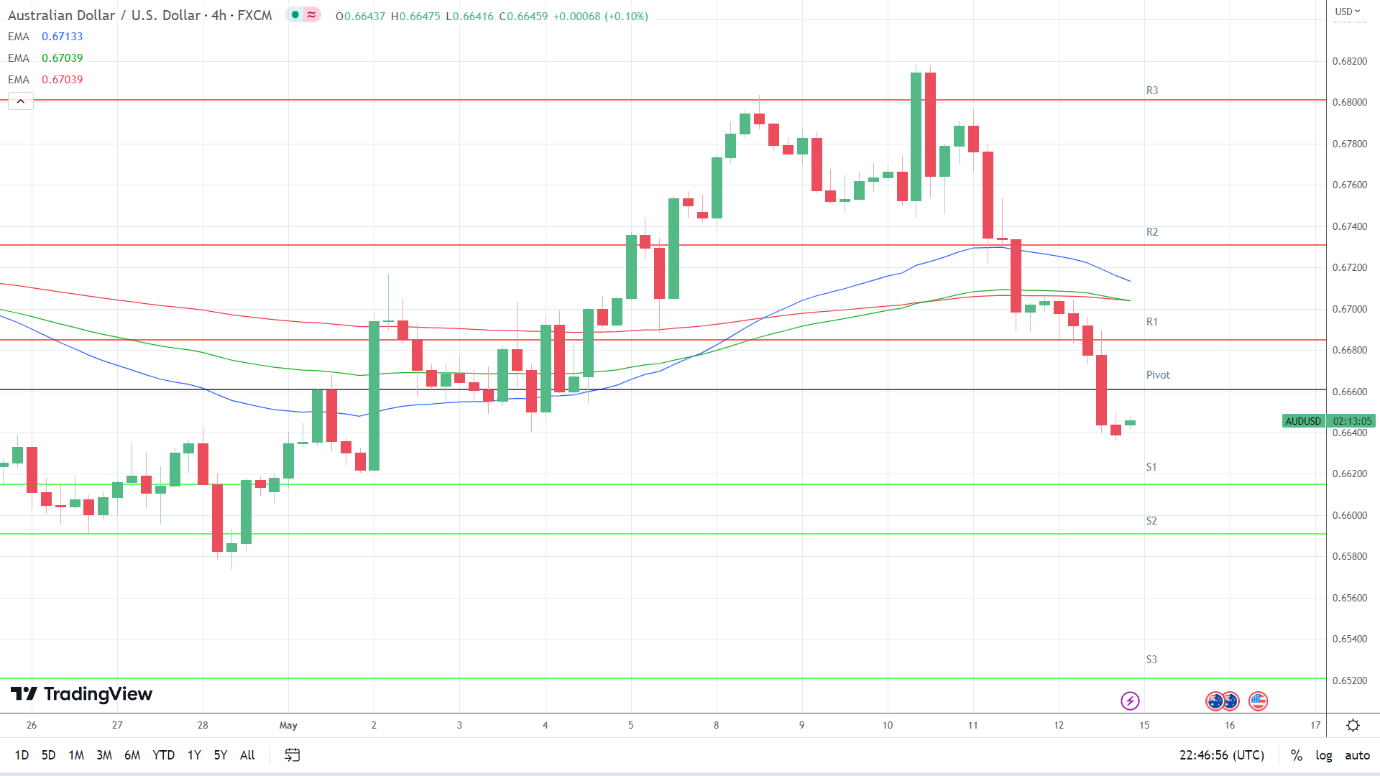
Looking at the EMAs and the 4-hourly chart, the EMAs sent bearish signals. The AUD/USD sits below the 200-day EMA, currently at $0.67045. The 50-day EMA narrowed to the 100-day EMA, with the 100-day EMA converging on the 200-day EMA, delivering bearish signals.
A move through R1 ($0.6685) and the 200-day ($0.67039) and 100-day ($0.67039) EMAs would support a breakout from the 50-day EMA ($0.67133) to target R1 ($0.6731). However, failure to move through the 200-day EMA ($0.67039) would leave S1 ($0.6615) in view. A move through the 50-day EMA would be a bullish signal.
NZD/USD Price Action
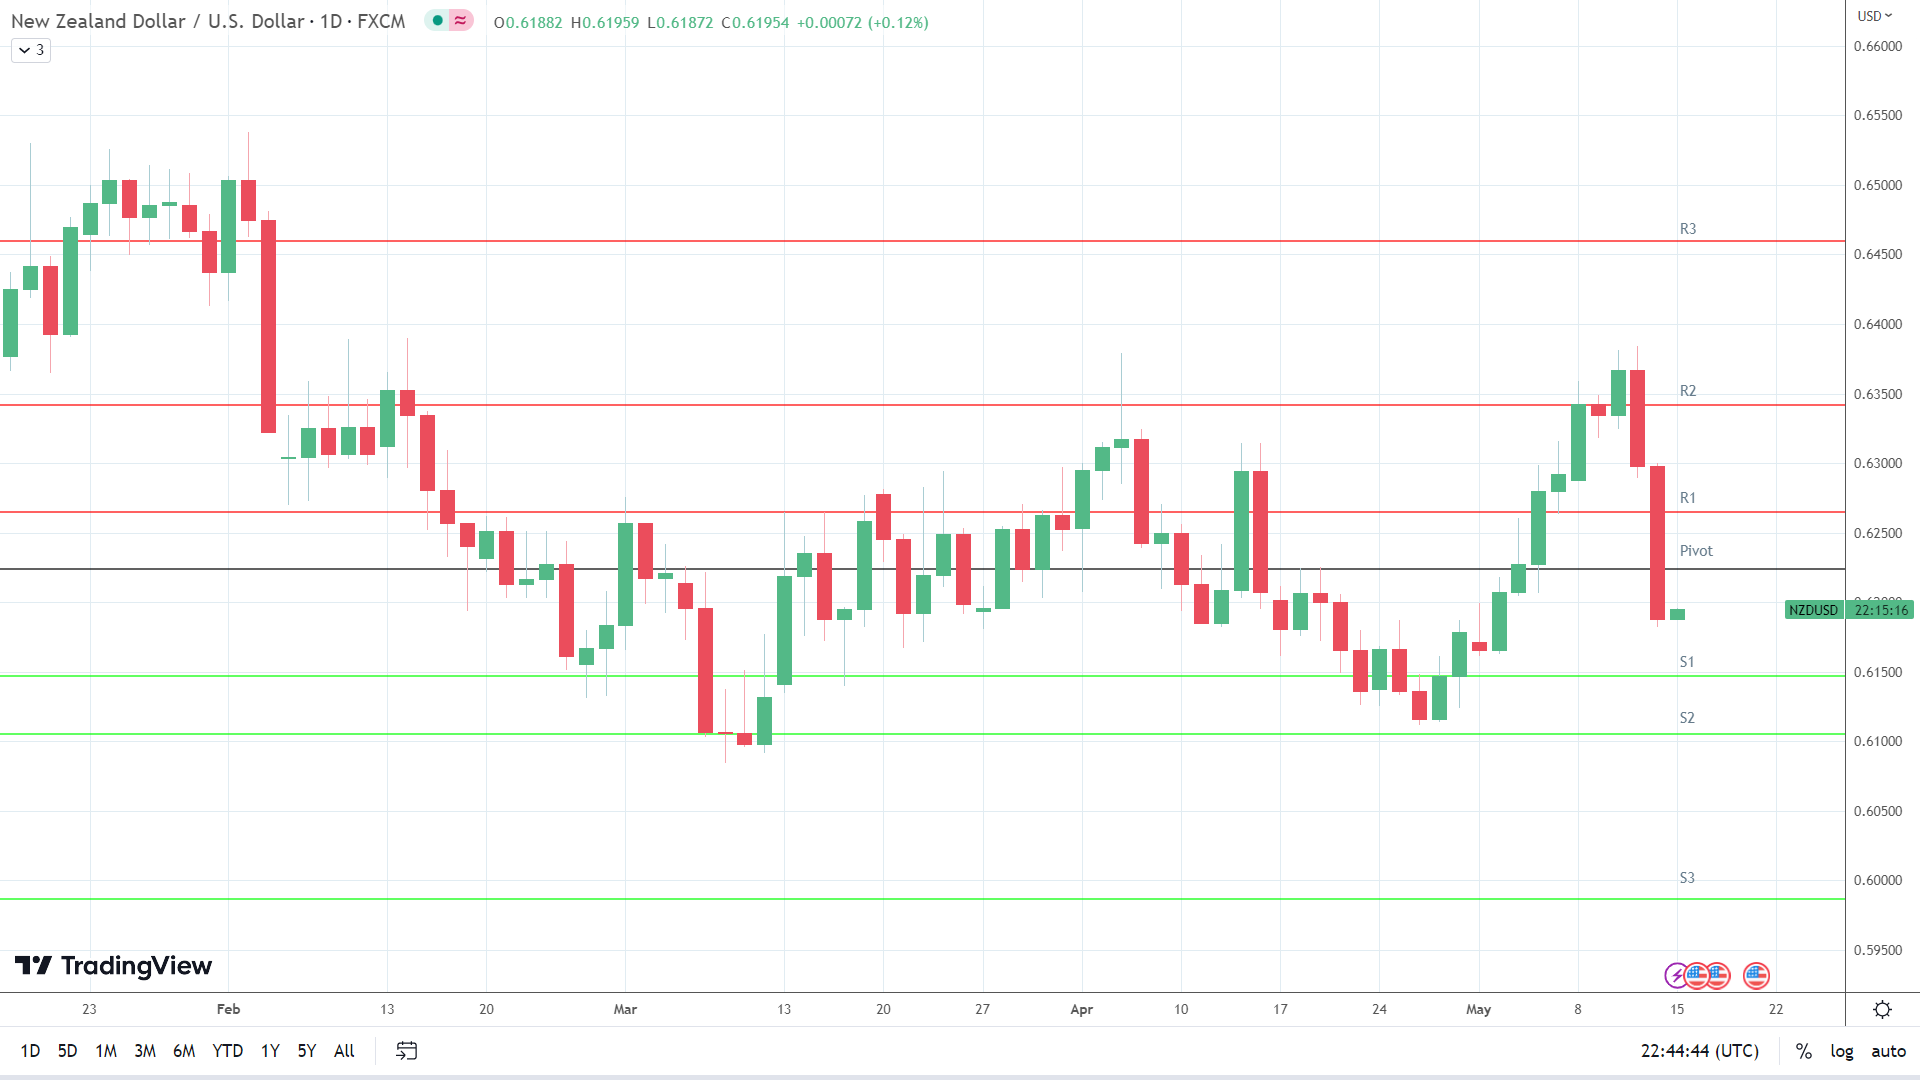
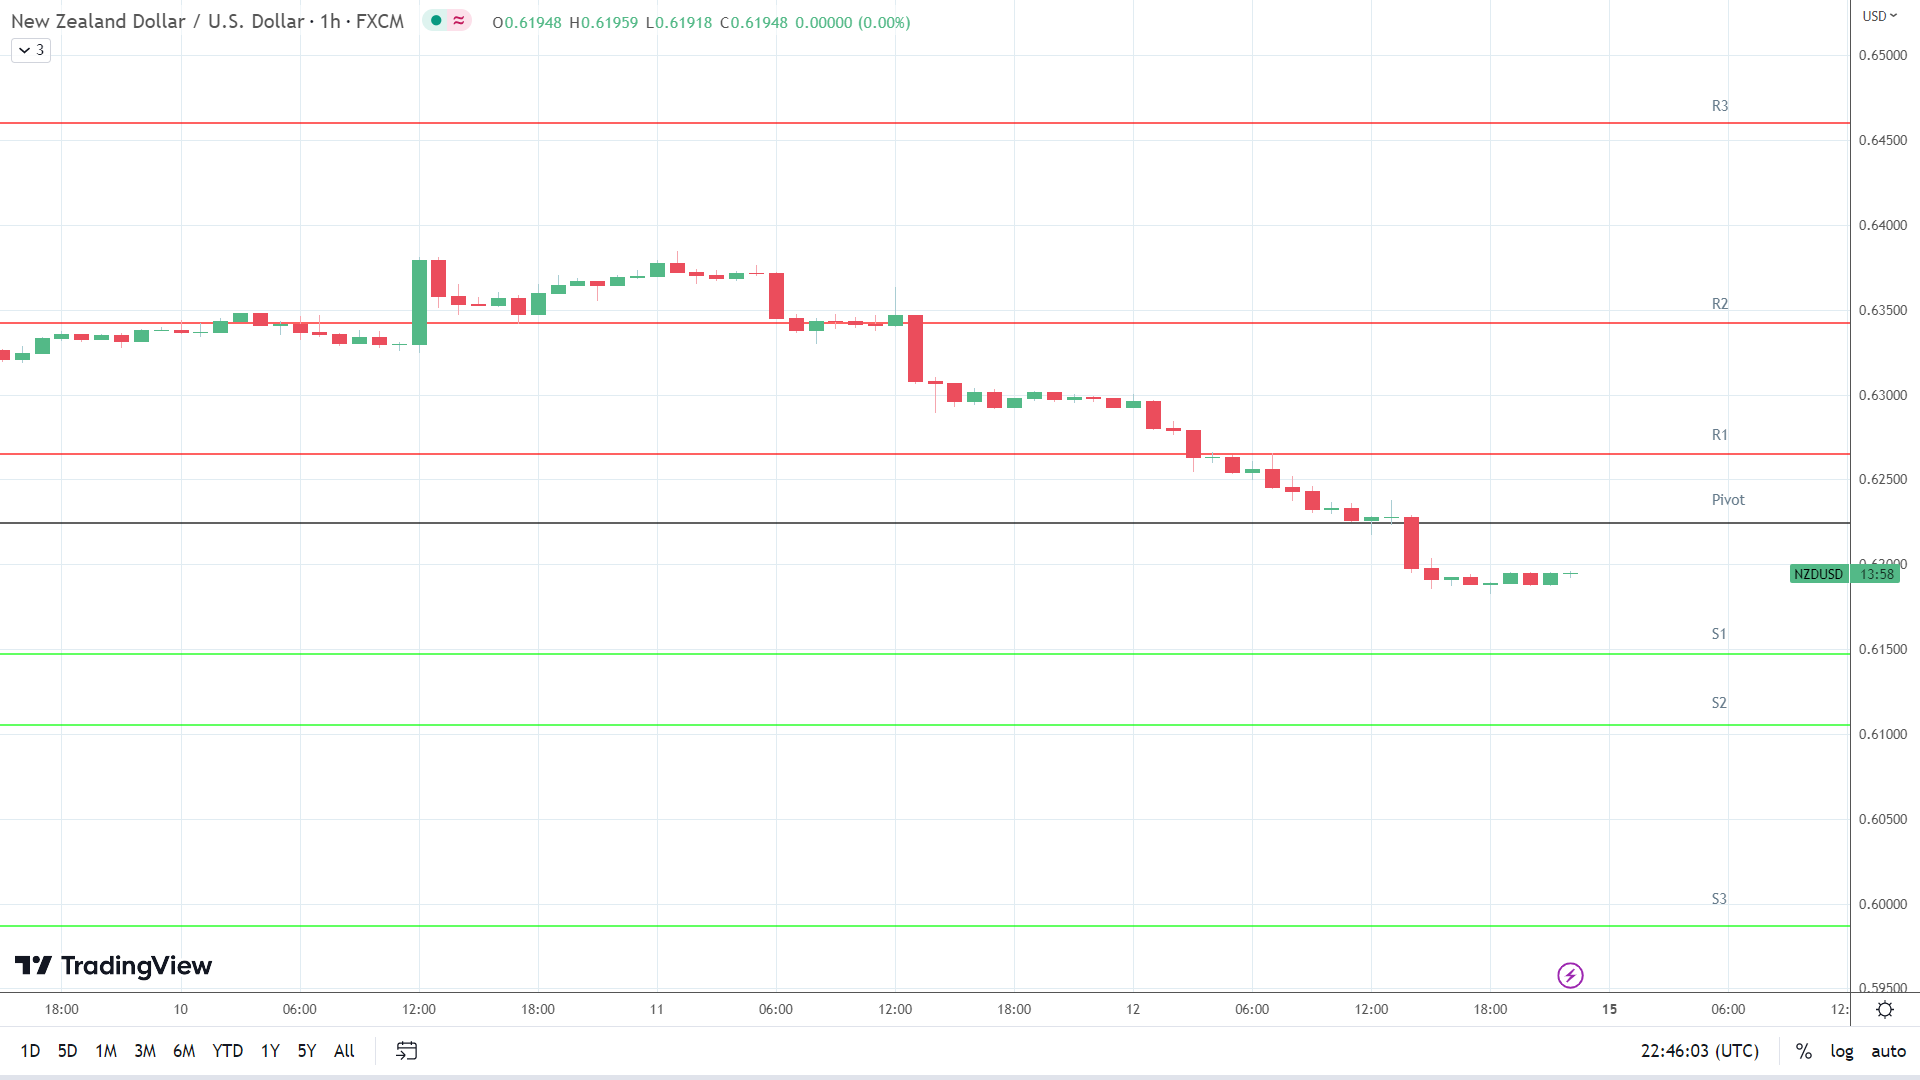
This morning, the NZD/USD was up 0.12% to $0.61954. A mixed start to the day saw the NZD/USD fall to an early low of $0.61872 before rising to a high of $0.61959.
Technical Indicators
Resistance & Support Levels
| R1 – $ | 0.6265 | S1 – $ | 0.6147 |
| R2 – $ | 0.6342 | S2 – $ | 0.6105 |
| R3 – $ | 0.6460 | S3 – $ | 0.5987 |
The NZD/USD has to move through the $0.6224 pivot to target the First Major Resistance Level (R1) at $0.6265. A return to $0.6250 would signal a bullish session. However, US debt ceiling news must support a session breakout.
In the case of a breakout session, the Kiwi would likely test resistance at the Friday high of $0.63003 but fall short of the Second Major Resistance Level (R2) at $0.6342. The Third Major Resistance Level (R3) sits at $0.6460.
Failure to move through the pivot would leave the First Major Support Level (S1) at $0.6147 in play. However, barring another sell-off, the NZD/USD should steer clear of the Second Major Support Level (S2) at $0.6105.
The Third Major Support Level (S3) sits at $0.5987.
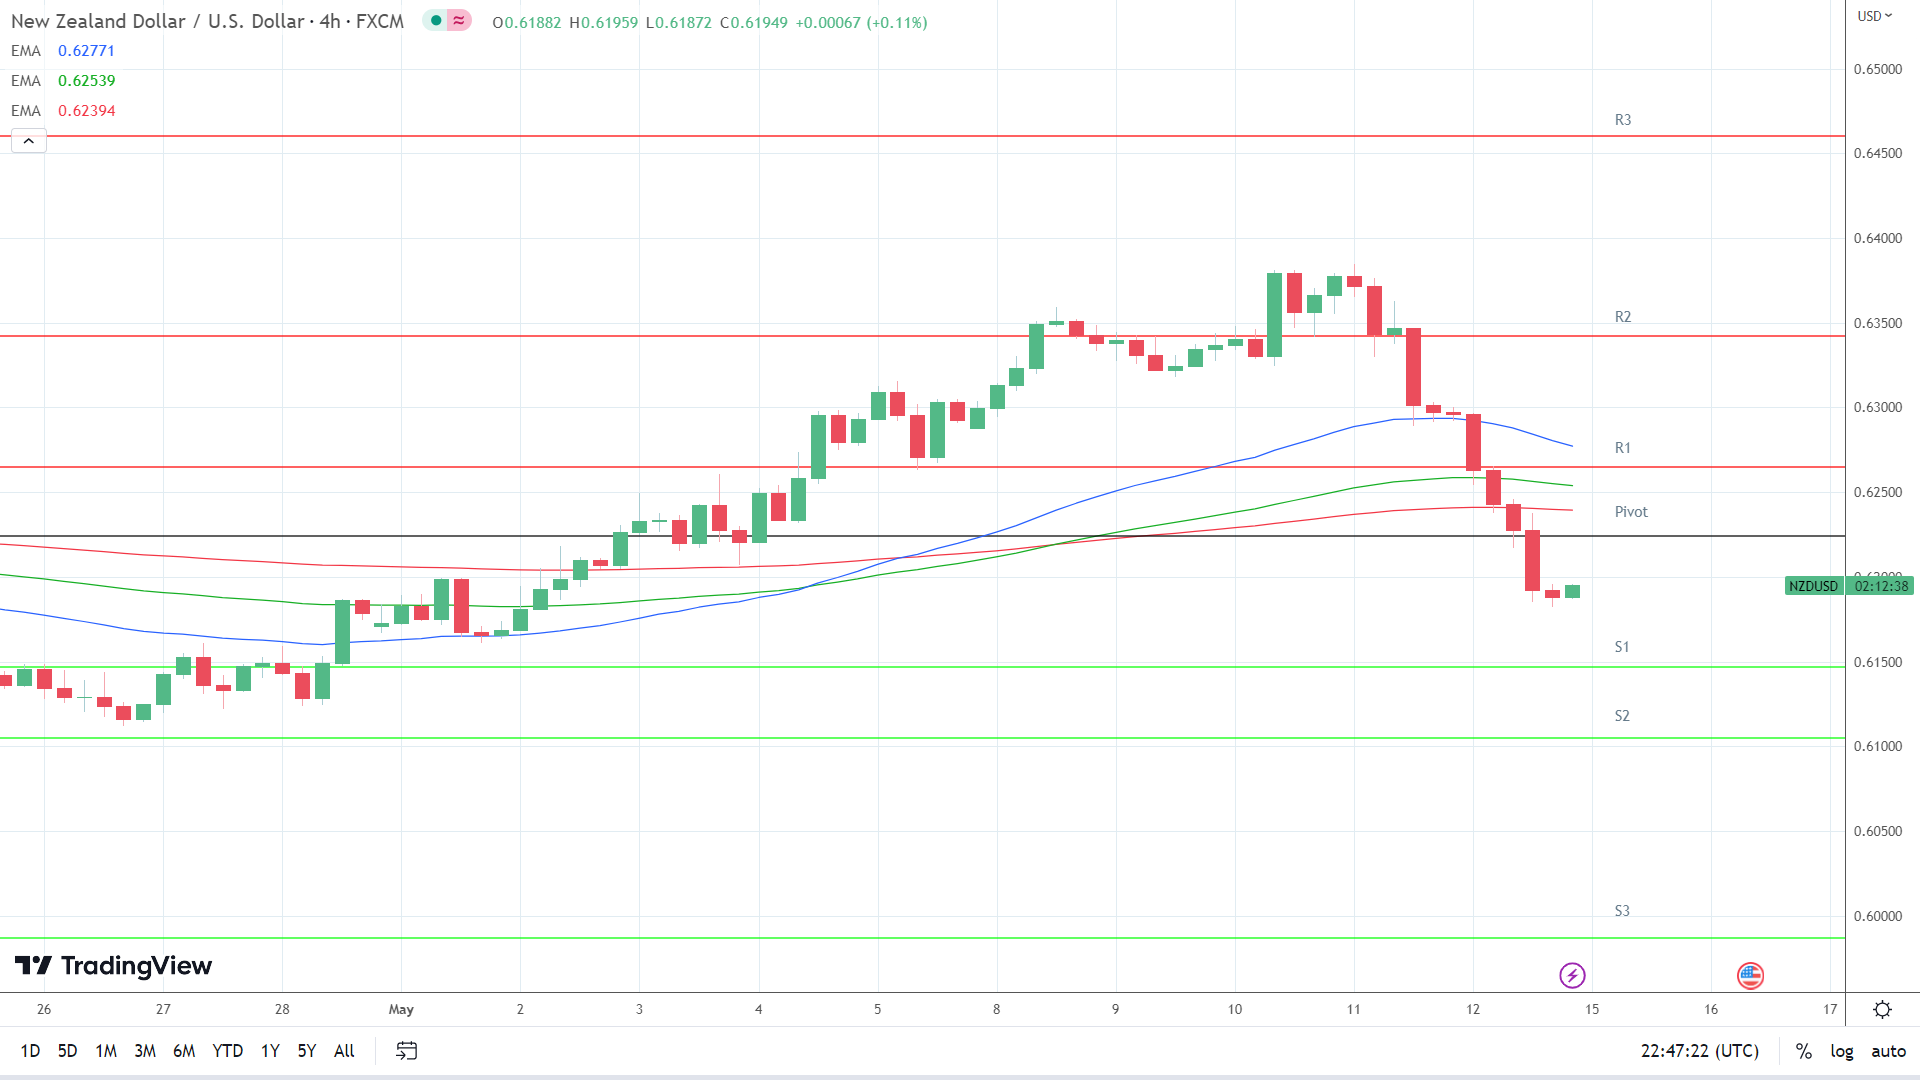
Looking at the EMAs and the 4-hourly chart, the EMAs sent bearish signals. The NZD/USD sits below the 200-day EMA, currently at $0.62394. The 50-day EMA narrowed to the 100-day EMA, with the 100-day EMA closing in on the 200-day EMA, delivering bearish signals.
A move through the 200-day ($0.62394) and 100-day ($0.62539) EMAs would support a breakout from R1 ($0.6265) to target the 50-day EMA ($0.62771). However, failure to move through the 200-day EMA ($0.62394) would leave S1 ($0.6147) in play. A move through the 50-day EMA would send a bullish signal.
About the Author
Bob Masonauthor
With over 20 years of experience in the finance industry, Bob has been managing regional teams across Europe and Asia and focusing on analytics across both corporate and financial institutions. Currently he is covering developments relating to the financial markets, including currencies, commodities, alternative asset classes, and global equities.
Did you find this article useful?
Latest news and analysis


Advertisement