
Advertisement
Advertisement
EUR/USD Forecast – Uncertainty Continues to Dominate EUR/USD Trade
By:
Be patient as low volatility is followed by higher volatility.
In this article:
EUR/USD Forecast Video for 21.12.22 by Bruce Powers
Another low volatility trading day for the EUR/USD. As of this writing the pair looks like it may finish inside the prior days range, and certainly stay within a four-day range with a high of 1.0663 and a low of 1.0576. Further, it remains inside the prior week’s high to low price range. Just remember, low volatility is followed by an increase in volatility.
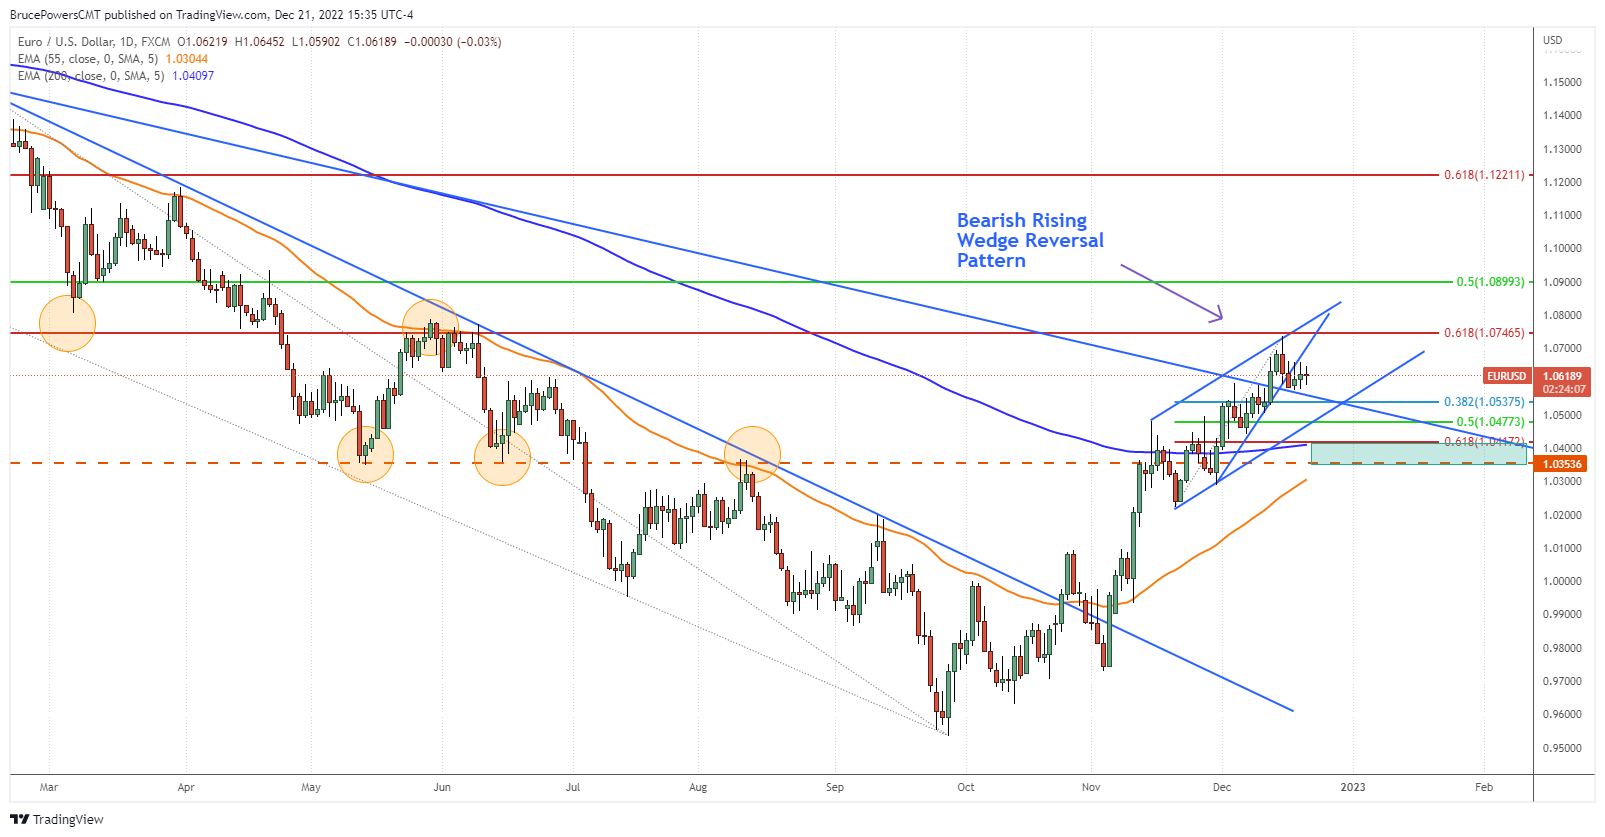
Last Friday the EUR/USD broke down out of a bearish rising wedge pattern but has since gone relatively sideways. It continues to hold above support of the long-term downtrend line. That line was exceeded to the upside only six days ago. So, the current minor pullback is the first test of the line as support since breaking above it.
Breakouts Should Be Followed by Price Moving
If price does not start to move quickly once a breakout trigger occurs the potential of the pattern to follow through as anticipated becomes suspect. This rising wedge is now suspect as to whether it will head down, evolve into a different pattern, or fail by breaking above the top of the pattern.
The top of the rising wedge is at 1.0736 and matches a 61.8% Fibonacci retracement level and prior price structure, which is where resistance and/or support was clearly seen in the past. This is a logical area for a correction of some degree. Continue to watch the trendline to see if price falls through it or is rejected at the line and moves higher. The price levels noted above for the current short-term range will also help signal direction.
Analysis of 4-Hour Chart Provides Additional Insights
Let’s look at a 4-hour intraday chart to see if it provides additional insight into recent price action. In the 4-hour chart a lower parallel line has been drawn to match the top line. The rising wedge is therefore contained within an evolving rising parallel trend channel. This could be dampening the reaction to the breakdown as there is conflicting information. We’ll have to see.
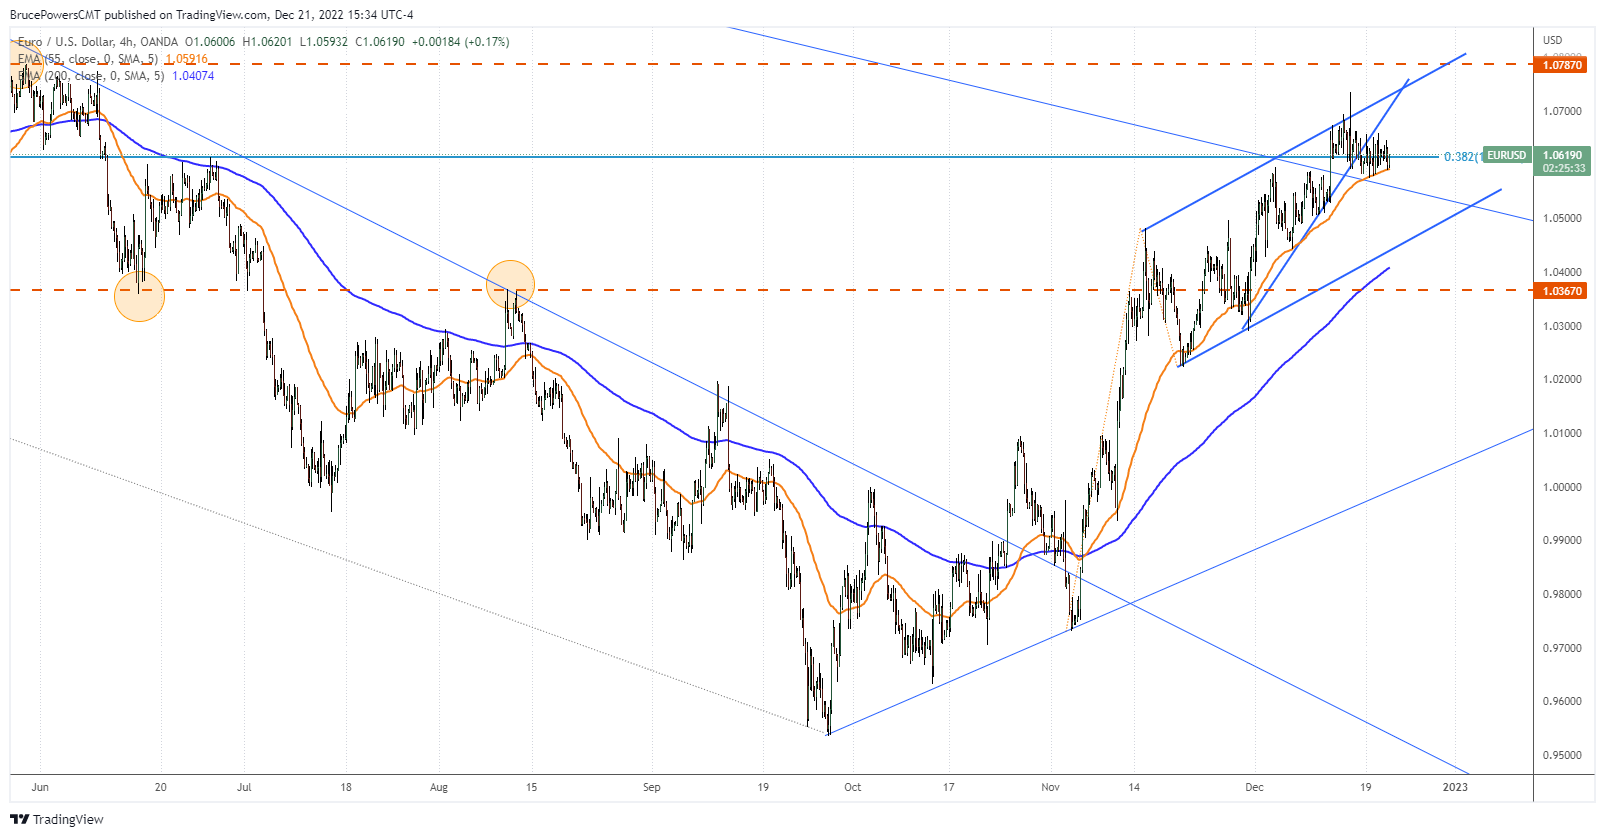
55-Day EMA is Good Trend Support on 4-Hour Chart
There is also a 55-Day EMA on the chart which is matching recent bottoms very nicely. That’s a good line to watch as a trend indicator on the 4-hour chart going forward. A drop below 1.0676 support (or below the 4-Hour EMA, now at 1.0590) shows the EUR/USD then targeting the lower rising trend line. That line is not too far from the 200 EMA, now at 1.0407. Lower targets can be seen on the daily chart above.
For a look at all of today’s economic events, check out our economic calendar.
About the Author
Bruce Powersauthor
Bruce boasts over 20 years in financial markets, holding senior roles such as Head of Trading Strategy at Relentless 13 Capital and Corporate Advisor at Chronos Futures. A CMT® charter holder and MBA in Finance, he's a renowned analyst and media figure, appearing on 150+ TV business shows.
Did you find this article useful?
Latest news and analysis


Advertisement