
Advertisement
Advertisement
AUD/USD Targets a Return to $0.66 Despite Weak Trade Data
By:
Following this morning's trade data from Australia, the AUD/USD and NZD/USD will sit in the hands of FOMC member chatter and US jobless claims.

In this article:
It was a quiet start to the Asian session for the AUD/USD and NZD/USD pairs. The Australian economy was in the spotlight, with trade data providing the AUD/USD direction.
In August, Australia’s trade surplus narrowed from A$8.733 billion to A$8.324 billion. Economists forecast a A$10.100 billion surplus.
According to the ABS,
- Goods and services exports rose A$1,434 million (2.6%), fueled by coal, coke, and briquettes.
- Imports of goods and services increased by A$2,077 million (4.5%), driven by fuels and lubricants.
Following this week’s RBA and RBNZ monetary policy decisions, the focus returns to the Fed. The dovish RBA move leaves the Aussie Dollar at risk of a return to sub-$0.64 over the near term. However, today’s US economic indicators and FOMC member chatter will need to support a 75-basis point Fed rate hike.
With the market focus shifting to US nonfarm payrolls on Friday, the jobless claims numbers will influence later today.
For the Kiwi Dollar, monetary policy divergence remains in favor of the greenback, despite the RBNZ sticking to its guns with the 50-basis point hike on Wednesday.
AUD/USD Price Action
At the time of writing, the Aussie was up 0.42% to $0.65129. A bullish start to the day saw the Aussie Dollar climb from an early low of $0.64840 to a high of $0.65194.
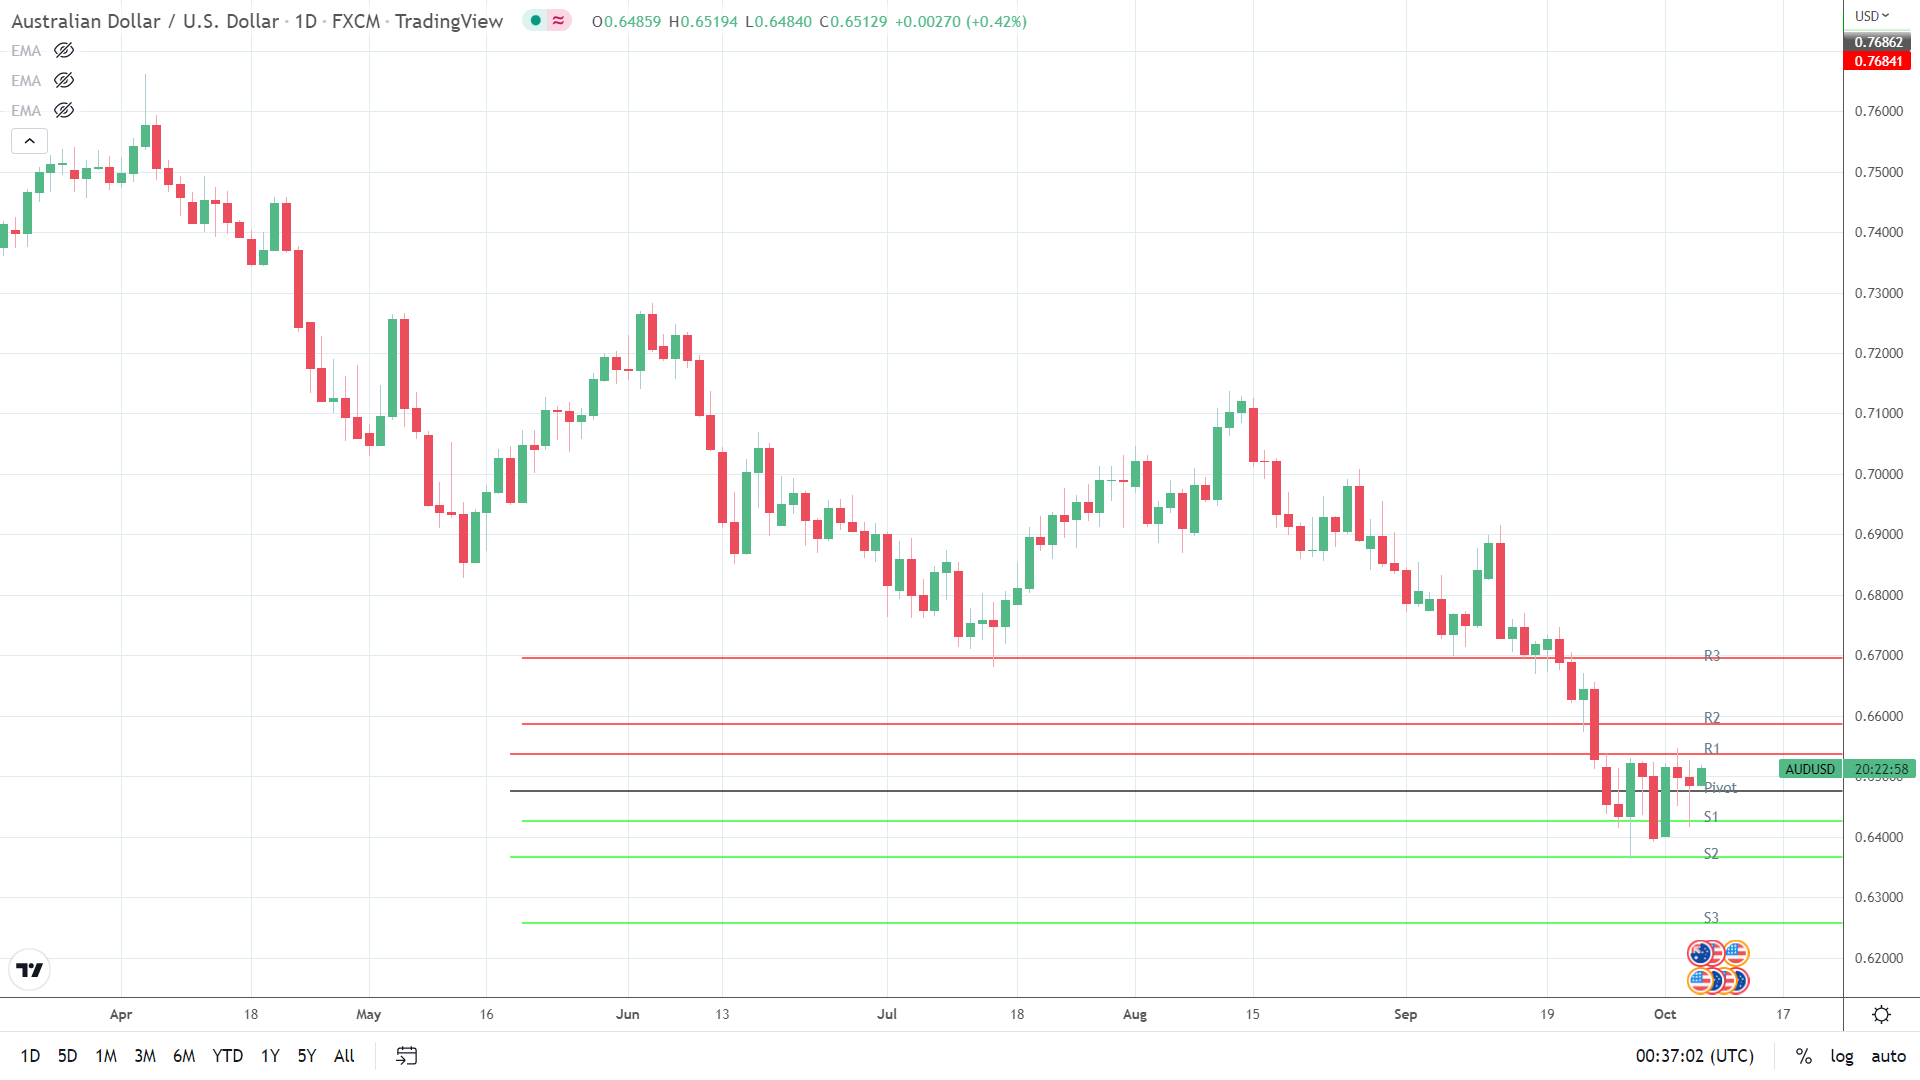
Technical Indicators
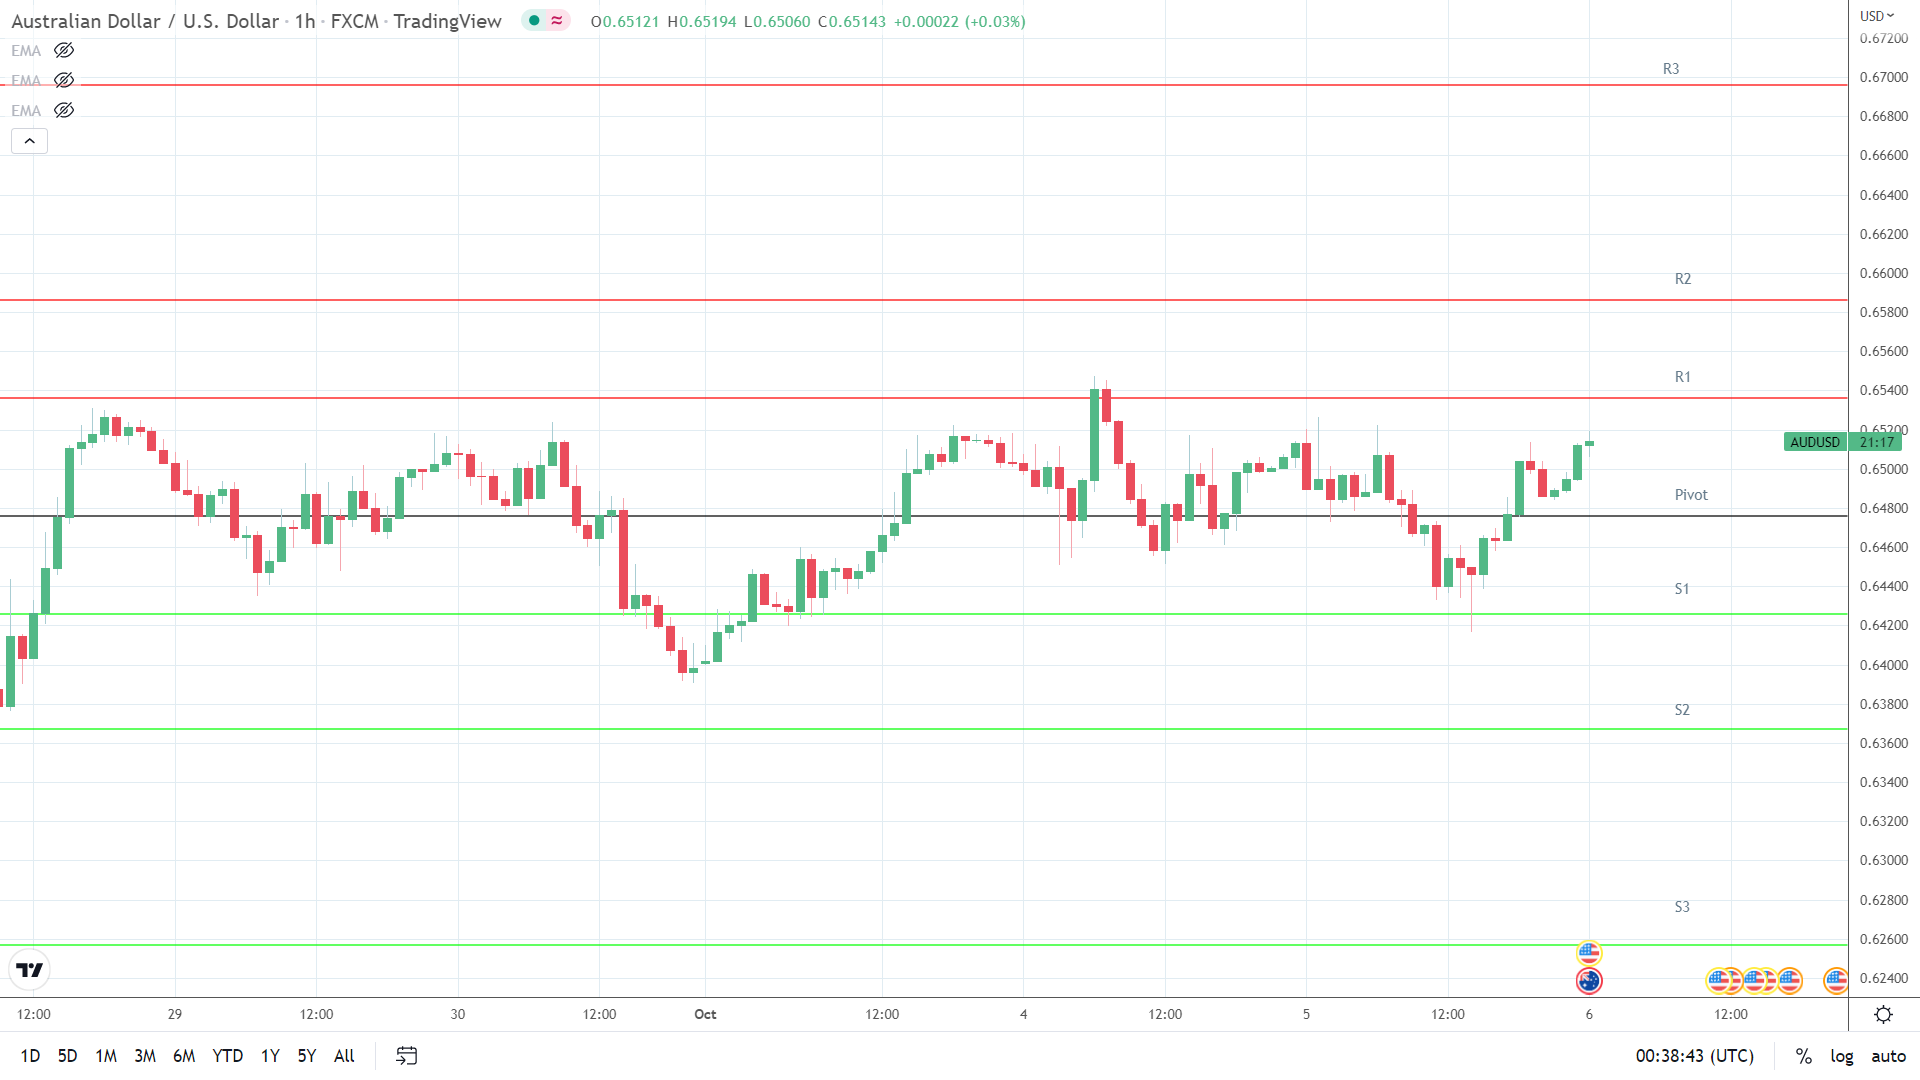
The AUD/USD needs to avoid the $0.6476 pivot to target the First Major Resistance Level (R1) at $0.6536. However, the Aussie Dollar would need a pickup in risk appetite to support a breakout from the Wednesday high of $0.65262.
In the case of a breakout session, the Aussie would likely test the Second Major Resistance Level (R2) at $0.6586. The Third Major Resistance Level (R3) sits at $0.6696.
A fall through the pivot would bring the First Major Support Level (S1) at $0.6426 into play. However, barring a market flight to safety, the AUD/USD pair would likely avoid sub-$0.64 and the Second Major Support Level (S2) at $0.6367.
The Third Major Support Level (S3) sits at $0.6257.
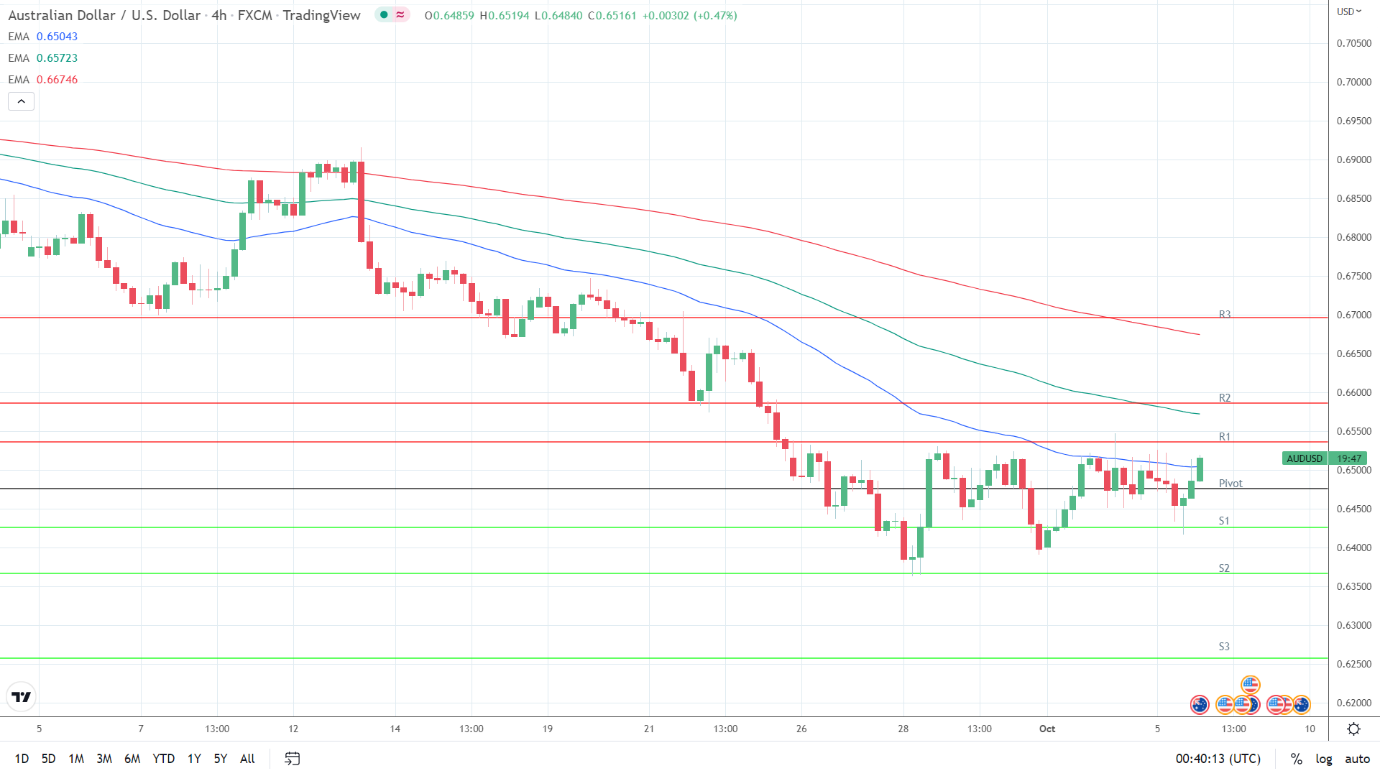
Looking at the EMAs and the 4-hourly chart, the EMAs send a bearish signal. The AUD/USD sits below the 100-day EMA, currently at $0.65723. The 50-day EMA flattened on the 100-day EMA, while the 100-day EMA fell back from the 200-day EMA, delivering mixed signals.
An AUD/USD hold above the 50-day EMA ($0.65043) would give the bulls a run at R1 ($0.6536) and the 100-day EMA ($0.65723). The 200-day EMA sits at $0.66746. However, a fall through the 50-day EMA would bring S1 ($0.6426) and sub-$0.64 into play.
NZD/USD Price Action
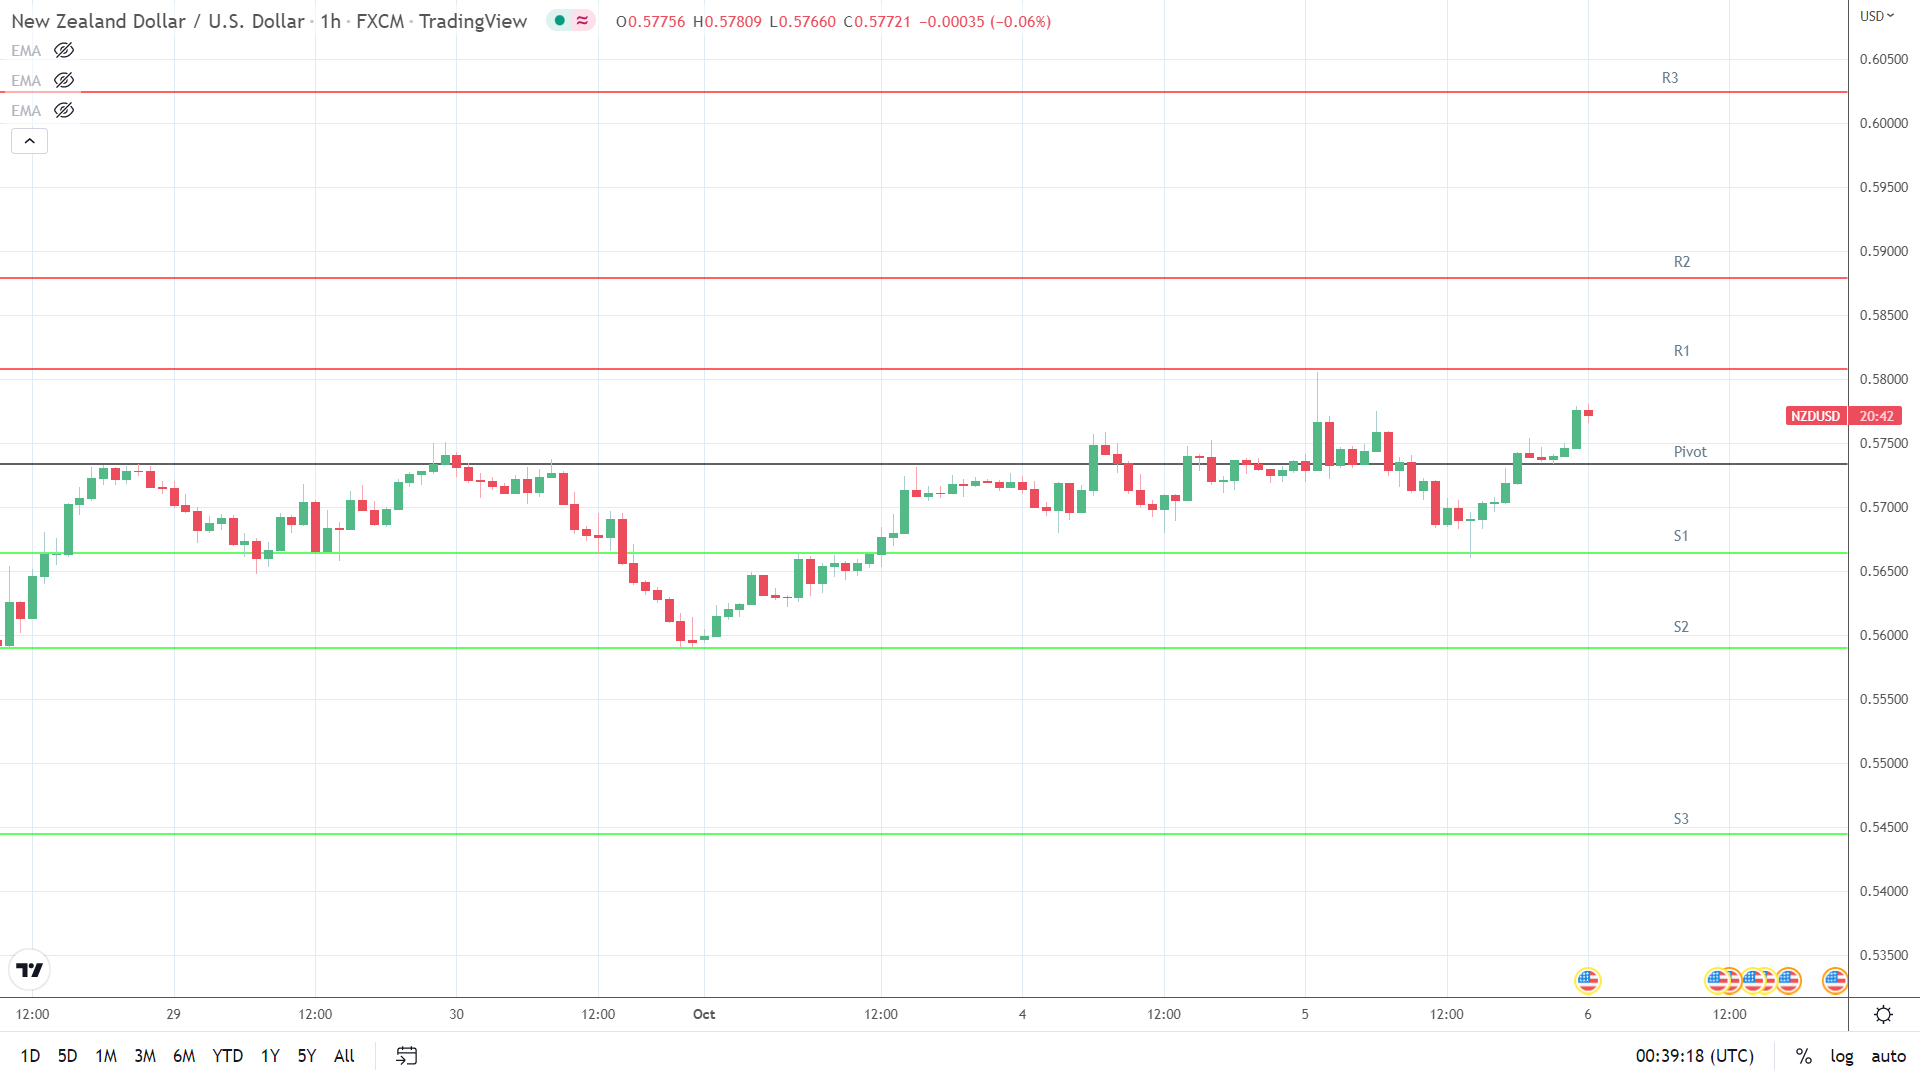
This morning, the Kiwi was up 0.57% to $0.57702. A bullish start to the day saw the NZD/USD rise from an early low of $0.57339 to a high of $0.57809.
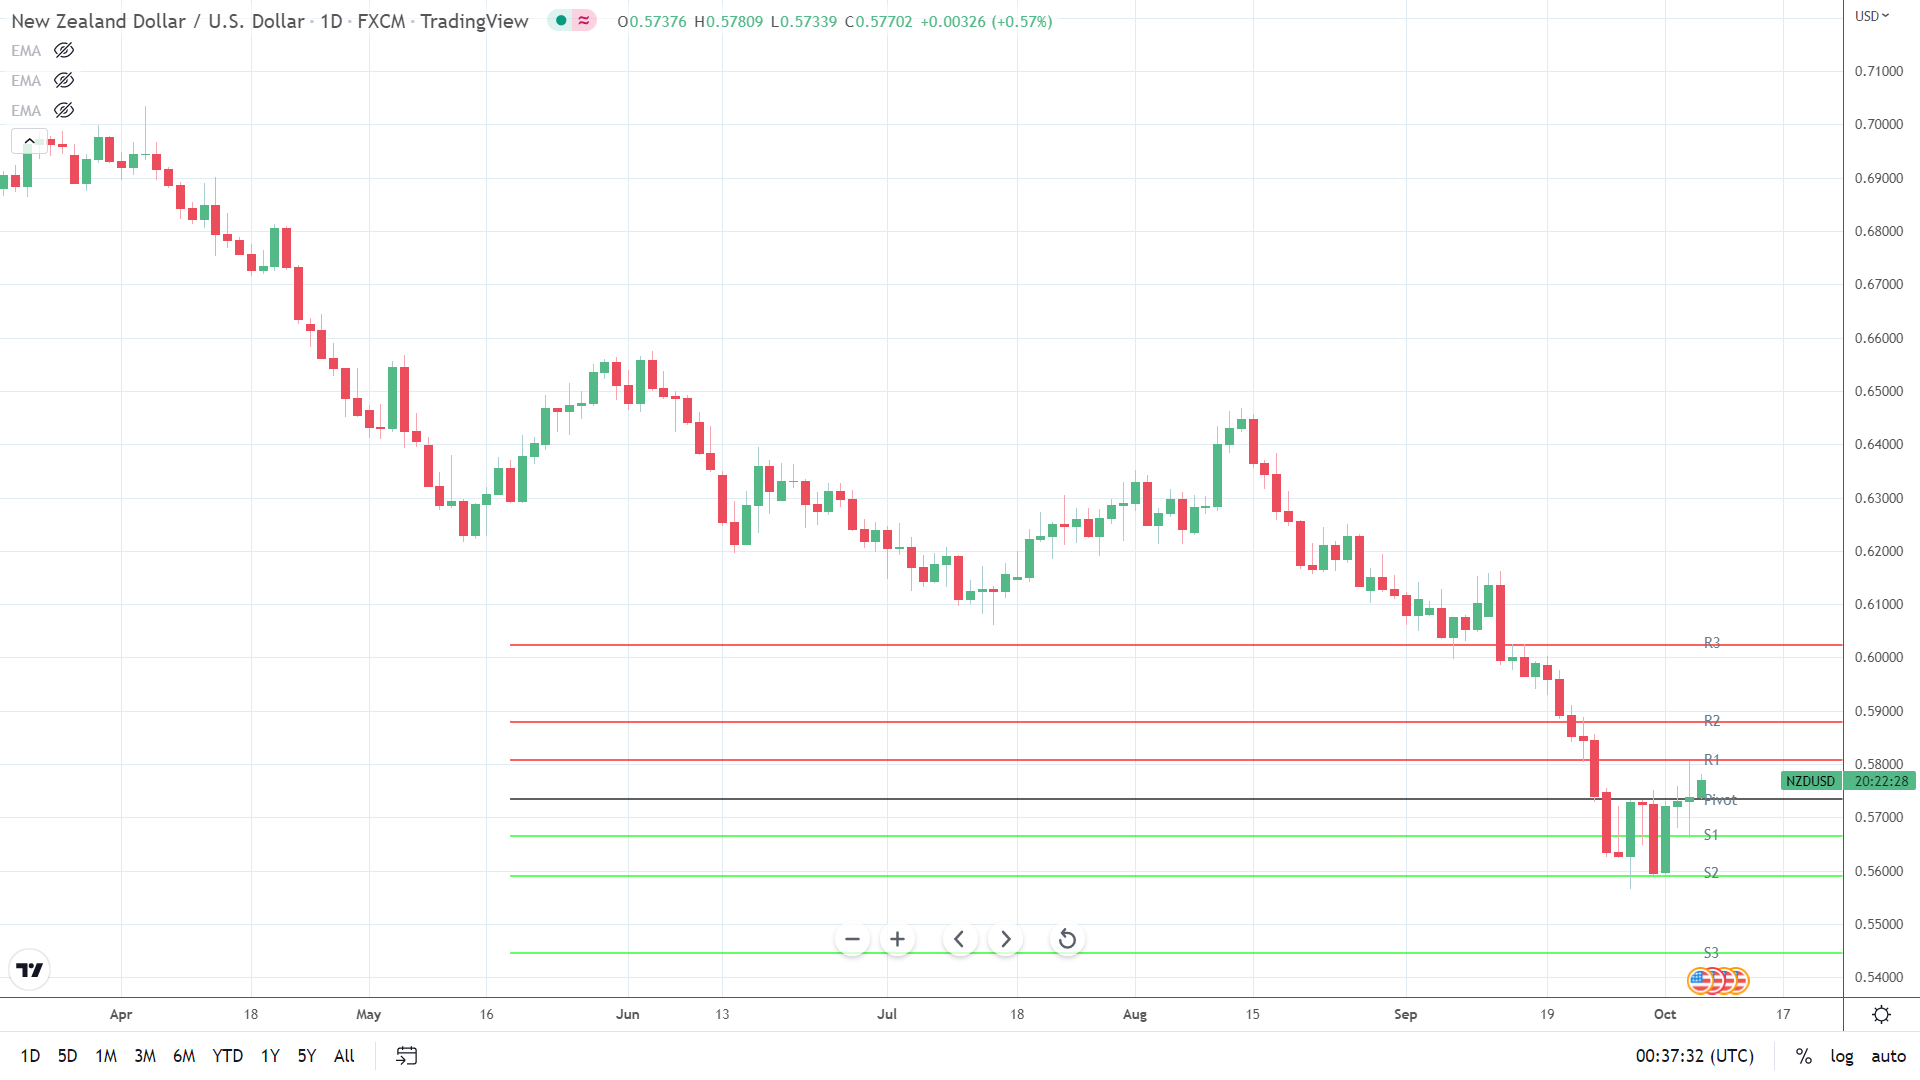
Technical Indicators
The NZD/USD needs to avoid the $0.5734 pivot to target the First Major Resistance Level (R1) at $0.5808. The Kiwi would also need a pickup in risk appetite to support a return to $0.58.
In the case of a breakout session, the Kiwi would likely test resistance at $0.5850 but fall short of the Second Major Resistance Level (R2) at $0.5879. The Third Major Resistance Level (R3) sits at $0.6024.
A fall through the pivot would bring the First Major Support Level (S1) at $0.5664 into play. However, barring a flight to safety, the NZD/USD pair would likely avoid sub-$0.56 and the Second Major Support Level (S2) at $0.5590.
The Third Major Support Level (S3) sits at $0.5445.
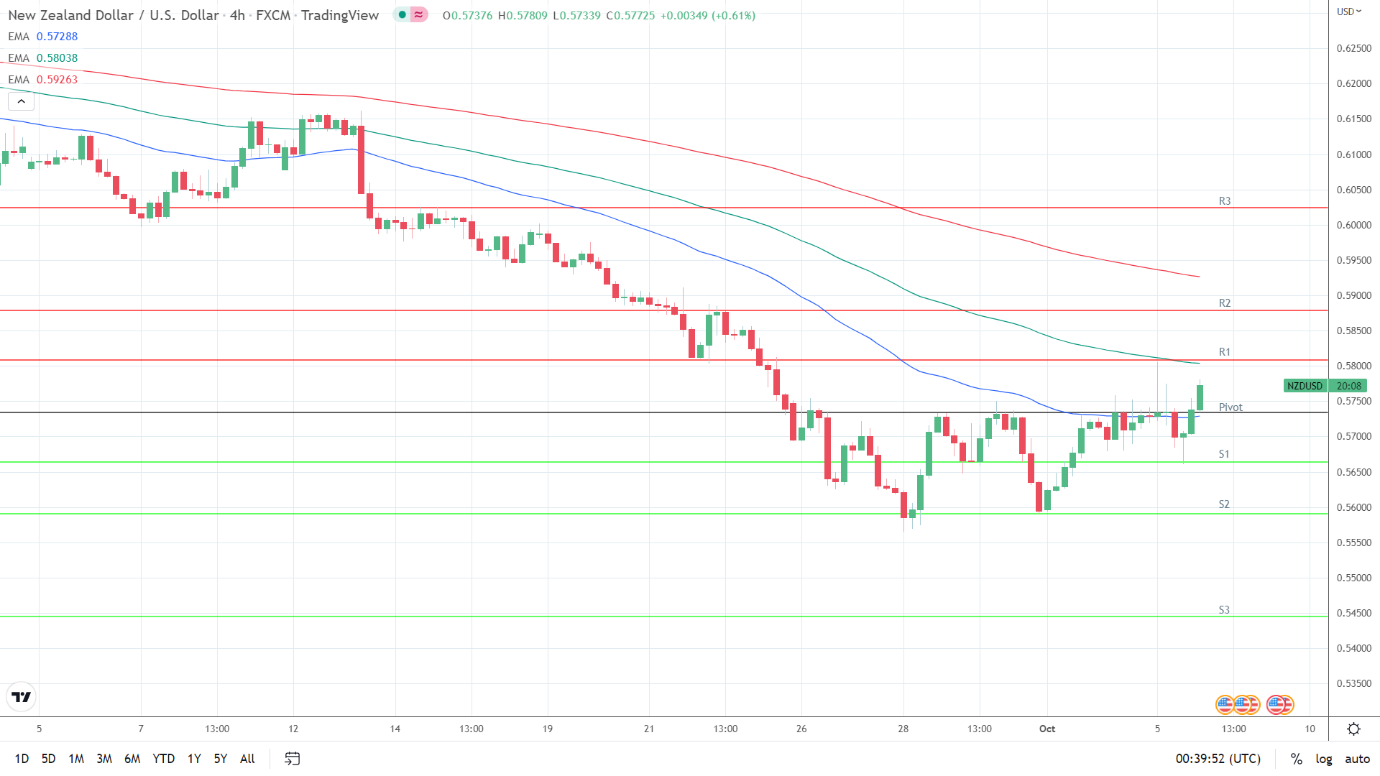
Looking at the EMAs and the 4-hourly chart, the EMAs send a bearish signal. The NZD/USD sits below the 100-day EMA, currently at $0.58038. The 50-day EMA narrowed to the 100-day EMA, while the 100-day EMA fell back from the 200-day EMA, delivering mixed signals.
An NZD/USD move through the 100-day EMA ($0.58038) and R1 ($0.5808) would give the bulls a run at $0.5850. The 200-day EMA sits at $0.59650. However, a fall through the 50-day EMA ($0.57288) would bring S1 ($0.5664) into play.
About the Author
Bob Masonauthor
With over 20 years of experience in the finance industry, Bob has been managing regional teams across Europe and Asia and focusing on analytics across both corporate and financial institutions. Currently he is covering developments relating to the financial markets, including currencies, commodities, alternative asset classes, and global equities.
Did you find this article useful?
Latest news and analysis


Advertisement