- Previous’ doji candle makes today’s close pivotal.
- Bearish doji reversal likely as 4hr chart shows a negative divergence of the RSI.
The much-needed technical correction in the USD/JPY pair will likely gather pace today, technical charts indicate.
At press time, the currency pair is trading at 112.70 - down 0.13 percent on the day, having clocked a six-month high of 113.14 yesterday.
The pullback from 113.14 to 112.70 indicates the bulls are keen on booking profits and is likely the beginning of a deeper correction, technical charts indicate.
Daily chart
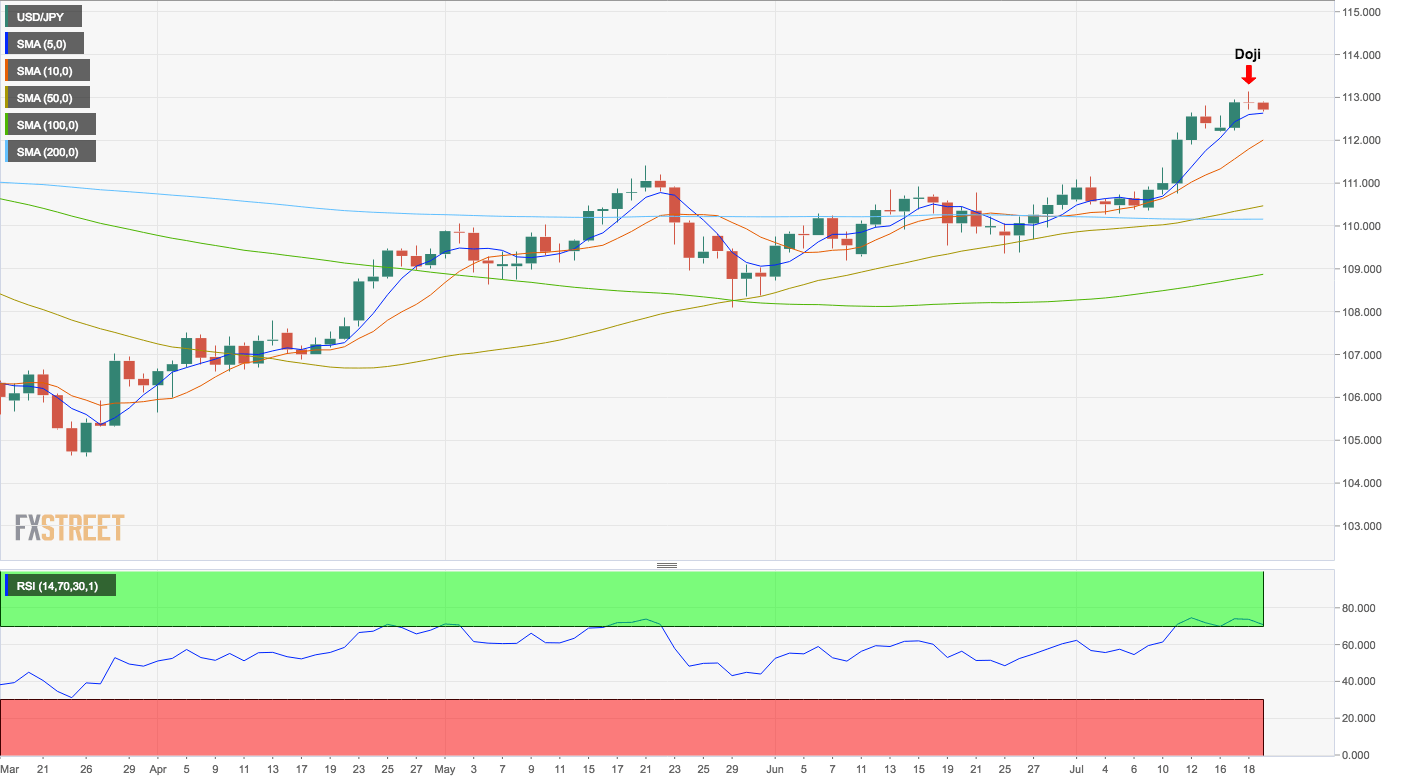
The pair created a doji candle yesterday, which usually represents indecision in the market place. However, when viewed against the backdrop of 8 percent rally from the March 26 low of 104.63, the doji candle indicates bullish exhaustion (or indecision among the bulls as the bears are already on the back foot).
Hence, the focus is on today’s UTC close. A bearish doji reversal, i.e. a short-term bullish-to-bearish trend change would occur if the spot closes below the previous day’s doji candle low of 112.71. If the reversal is confirmed, then the pair will likely revisit 111.40 (May 21 high).
On the other hand, a close today above 113.14 (previous day’s doji candle high) would signal continuation of the rally, although with the 14-day relative strength index (RSI) reporting overbought conditions, the upside could be capped around 113.27/28 (200-week moving average + 61.8% of 2017-18 slide).
That said, the short duration charts indicate a bearish doji is more like to occur than not.
4-hour chart
-636675592813582676.png)
The bearish divergence of the RSI and the head-and-shoulders breakdown on the RSI, as seen in the above chart, indicates the spot could test bids around 112.00, which marks the confluence of ascending (bullish) 10-day moving average (MA) and 50-candle MA on 4-hour chart.
Note that the path of least resistance is to the upside as the 5-day and 10-day MA are trending north. Further, major moving averages (50, 100 and 200) on the 4-hour chart are rising and are located one above the other.
Should the pair pick up a bid around 112.00, then a re-test of 113.00 cannot be ruled out.
View
- The pair risks bearish doji reversal and hence could drop to 111.40 (May 21 high) soon.
- The MAs are biased towards the bulls. Hence, I am unable to rule out the probability of a solid rebound from 112.00.
- A deeper pullback could bode well as it would help recharge the engine for a convincing break above 113.27/28 (200-week moving average + 61.8% of 2017-18 slide).
Information on these pages contains forward-looking statements that involve risks and uncertainties. Markets and instruments profiled on this page are for informational purposes only and should not in any way come across as a recommendation to buy or sell in these assets. You should do your own thorough research before making any investment decisions. FXStreet does not in any way guarantee that this information is free from mistakes, errors, or material misstatements. It also does not guarantee that this information is of a timely nature. Investing in Open Markets involves a great deal of risk, including the loss of all or a portion of your investment, as well as emotional distress. All risks, losses and costs associated with investing, including total loss of principal, are your responsibility. The views and opinions expressed in this article are those of the authors and do not necessarily reflect the official policy or position of FXStreet nor its advertisers. The author will not be held responsible for information that is found at the end of links posted on this page.
If not otherwise explicitly mentioned in the body of the article, at the time of writing, the author has no position in any stock mentioned in this article and no business relationship with any company mentioned. The author has not received compensation for writing this article, other than from FXStreet.
FXStreet and the author do not provide personalized recommendations. The author makes no representations as to the accuracy, completeness, or suitability of this information. FXStreet and the author will not be liable for any errors, omissions or any losses, injuries or damages arising from this information and its display or use. Errors and omissions excepted.
The author and FXStreet are not registered investment advisors and nothing in this article is intended to be investment advice.
Recommended Content
Editors’ Picks
EUR/USD turns negative near 1.0760

The sudden bout of strength in the Greenback sponsored the resurgence of the selling pressure in the risk complex, dragging EUR/USD to the area of daily lows near 1.0760.
GBP/USD comes under pressure and challenges 1.2500

GBP/USD now rapidly loses momentum and gives away initial gains, returning to the 1.2500 region on the back of the strong comeback of the US Dollar.
Gold retreats from highs on stronger Dollar, yields

XAU/USD trims part of its initial advance in response to the jump in the Dollar's buying interest and the re-emergence of the upside pressure in US yields.
XRP tests support at $0.50 as Ripple joins alliance to work on blockchain recovery

XRP trades around $0.5174 early on Friday, wiping out gains from earlier in the week, as Ripple announced it has joined an alliance to support digital asset recovery alongside Hedera and the Algorand Foundation.
Week ahead – US inflation numbers to shake Fed rate cut bets

Fed rate-cut speculators rest hopes on US inflation data. After dovish BoE, pound traders turn to UK job numbers. Will a strong labor market convince the RBA to hike? More Chinese data on tap amid signs of slow Q2 start.