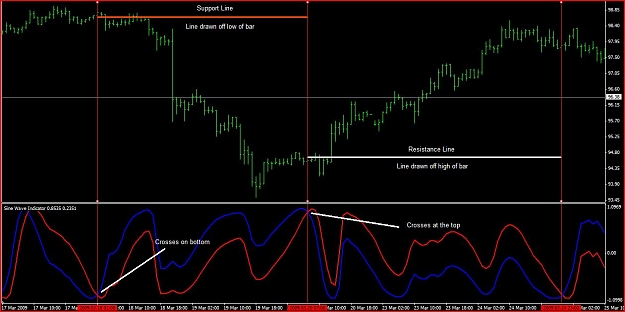
Can anyone help add support and resistance lines to this sinewave indicator. What I would like is to have a resistance line drawn on the high of the bar when the two lines cross at the top of the window(overbought area), and a support line drawn on the low of the bar when the two lines cross at the bottom (oversold area). I've had some good success trading off these S/R levels. Any help would be appreciated!
Here's a pic so you can see what I mean.
Here's a pic so you can see what I mean.
Attached Image (click to enlarge)
Attached File(s)