A trade entry approach I recently saw looks quite good. It was presented on a 4-hour chart.
It goes like this.
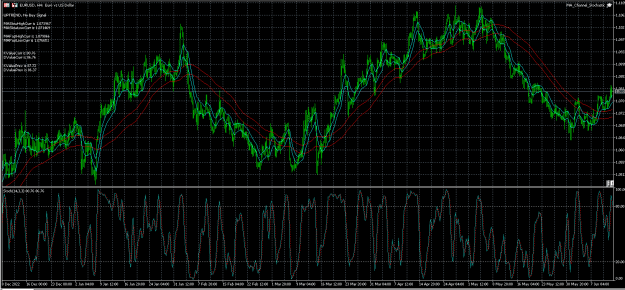
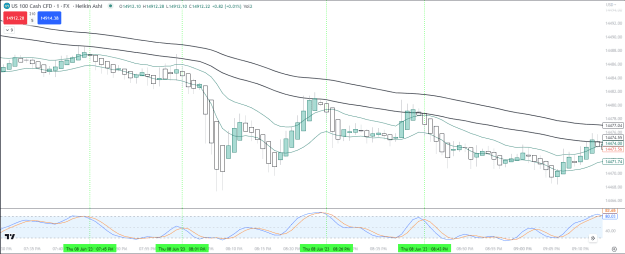
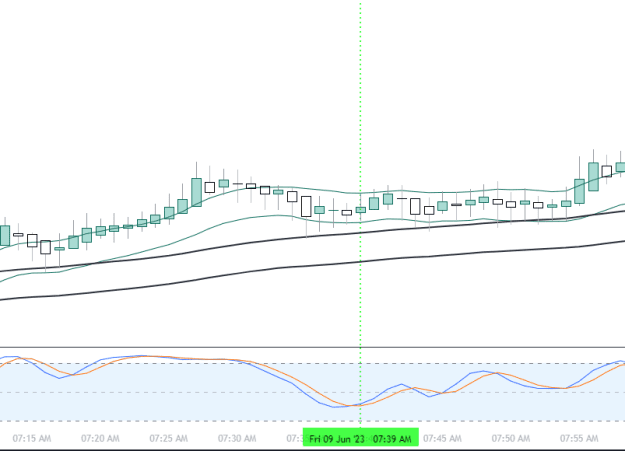
//| 1) Create two pairs of moving average indicators as follows:
//| a) 72-period Simple Moving Average of the highs
//| b) 72-period Simple Moving Average of the lows
//| c) 12-period Exponential Moving Average of the highs
//| d) 12-period Exponential Moving Average of the lows
//|
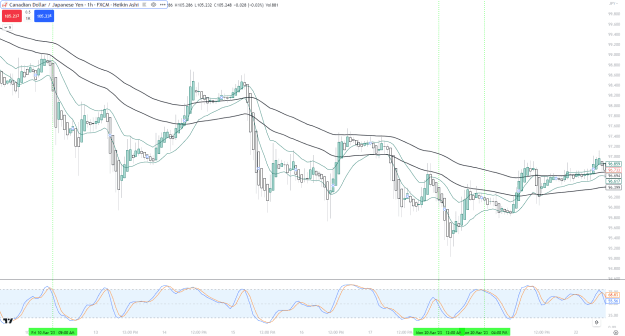
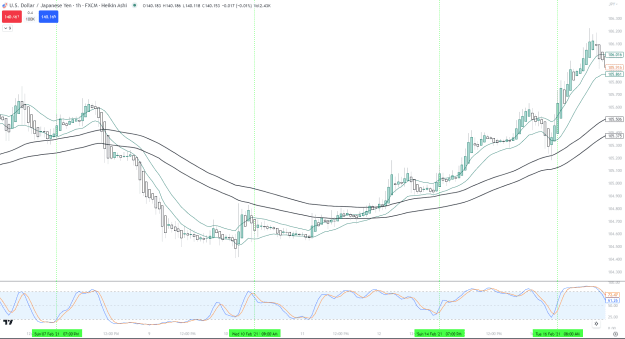
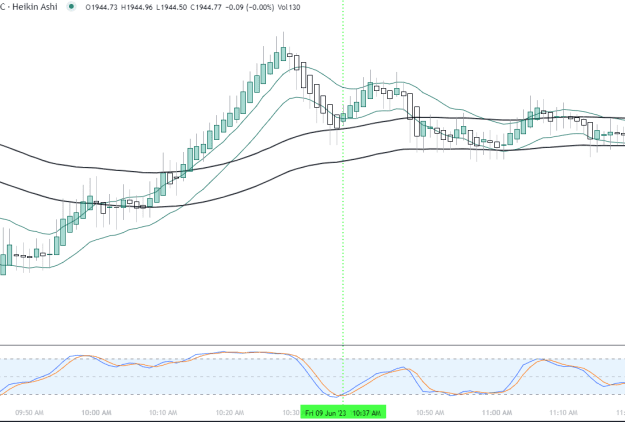
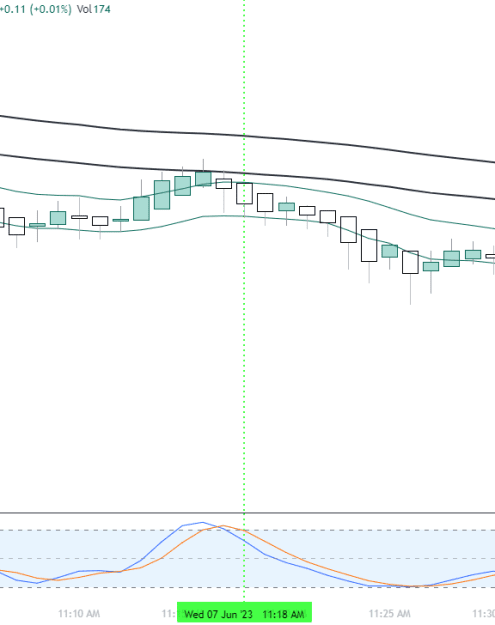
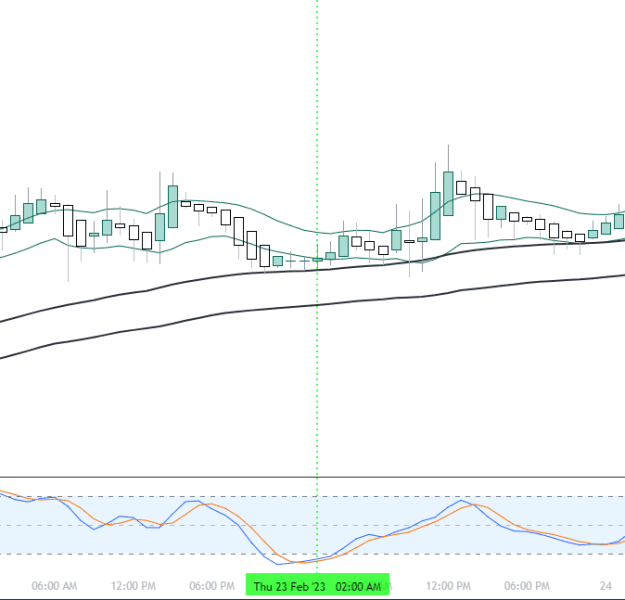
//| This sets up two bands or channels.
//|
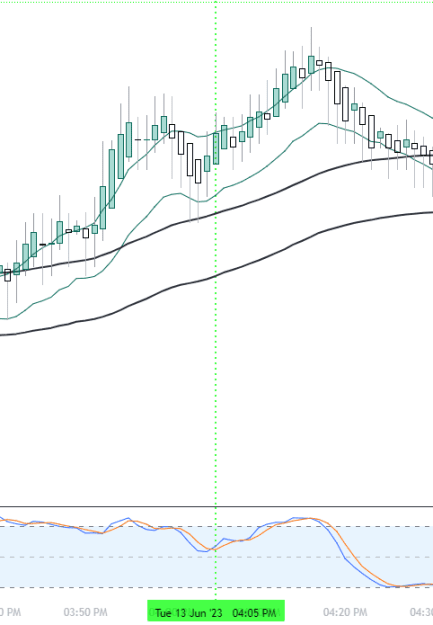
//| When the 12-period moving average band sits above the
//| 72-period band, we consider the trend to be up. When this
//| condition holds true, we will only take long trades.
//|
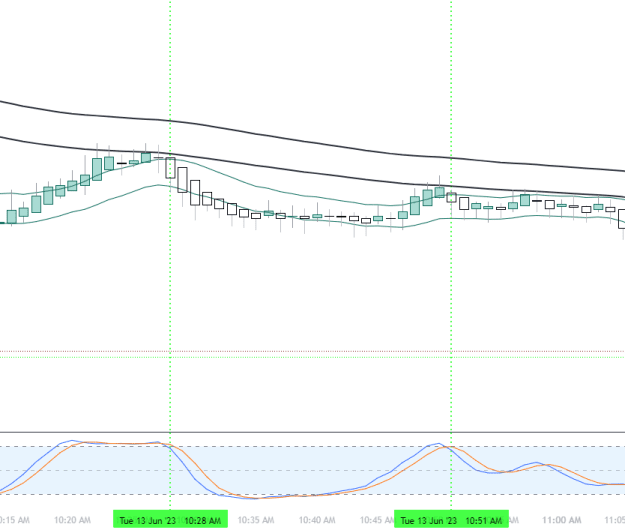
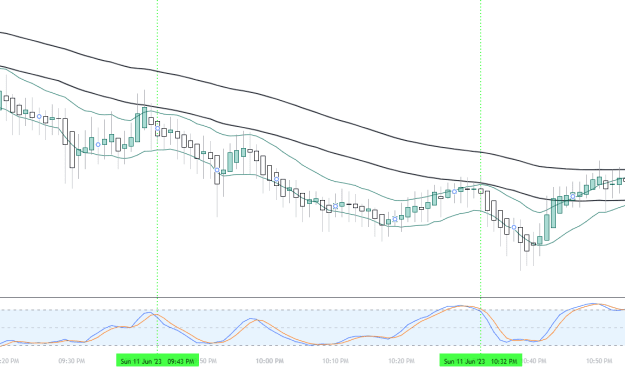
//| When the 12-period moving average band sits below the
//| 72-period band, we consider the trend to be down. When this
//| condition holds true, we will only take short trades.
//|
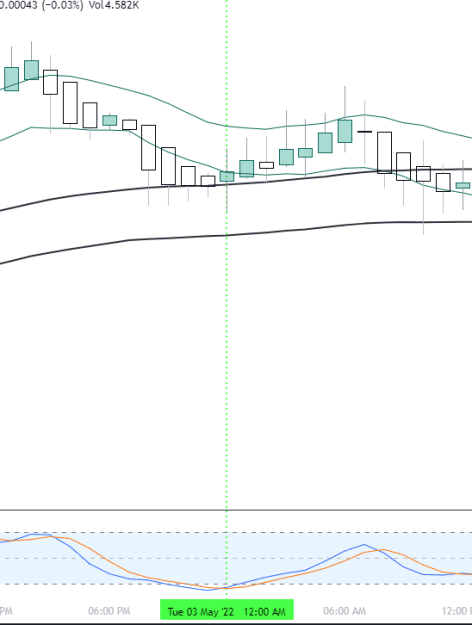
//| We do not open trades when any parts of the two bands are
//| touching or overlapping.
//|
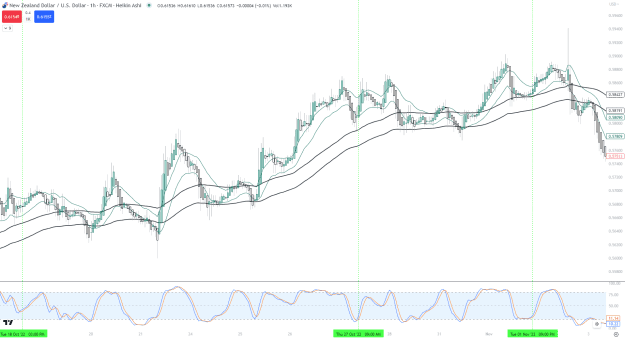
//| The trade entry signal is the Stochastic indicator with
//| a %K period of 14, a %D period of 3, and a smoothing value
//| of 3.
//|
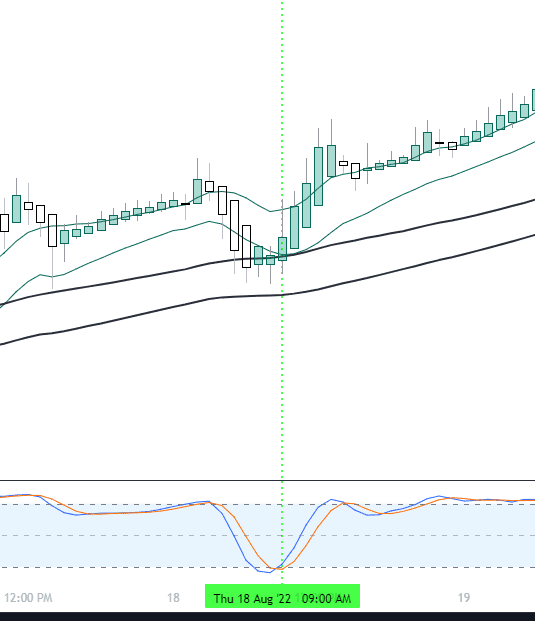
//| For long trades, we look for the %K value to cross above
//| the %D value after the %K value has dropped below the 65 level.
//|
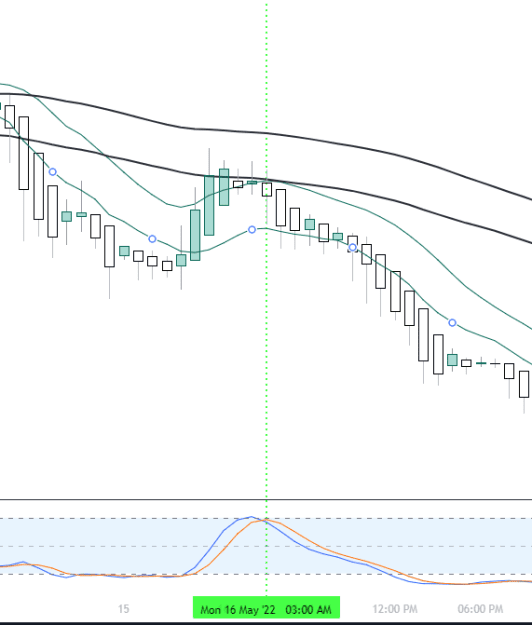
//| For short trades, we look for the %K line to cross below
//| the %D value after the %K value has risen above the 35 level.
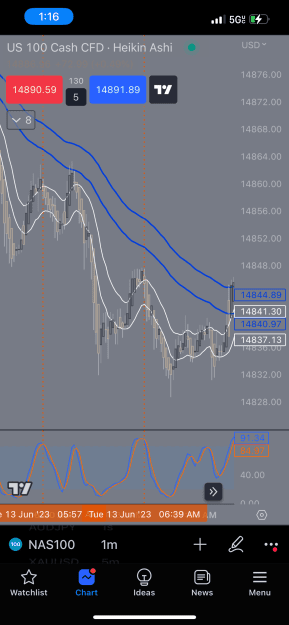
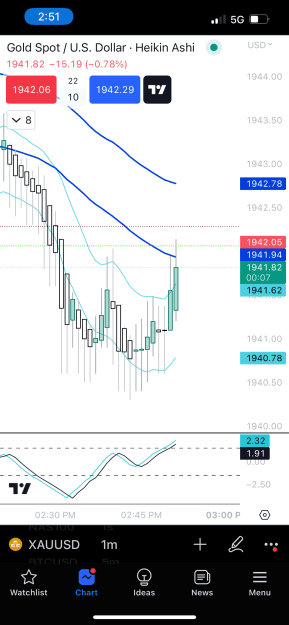
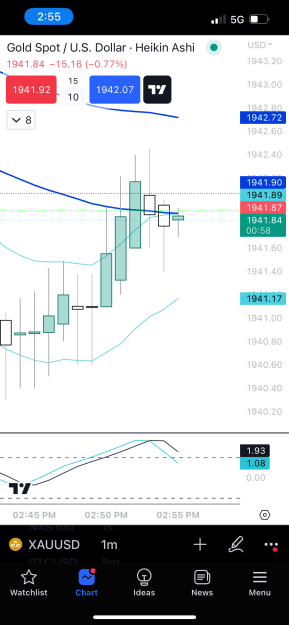
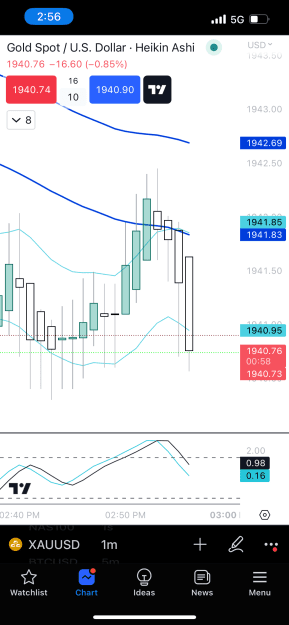
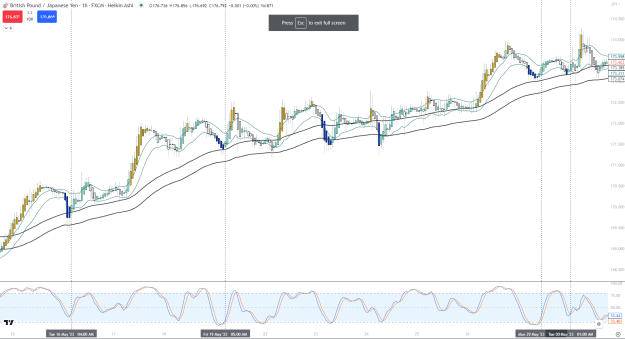
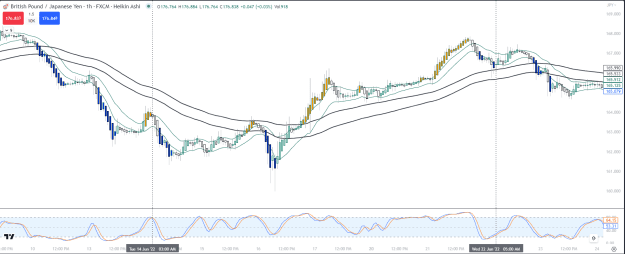
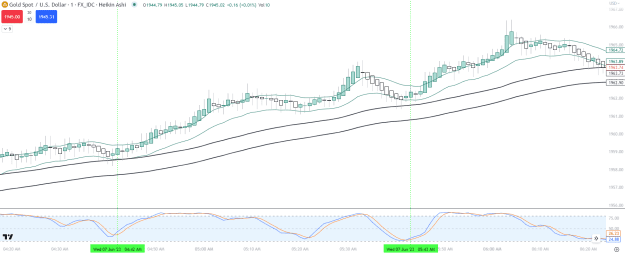
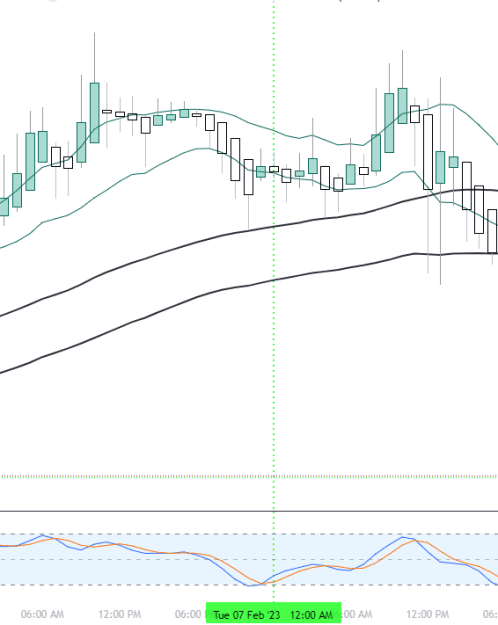
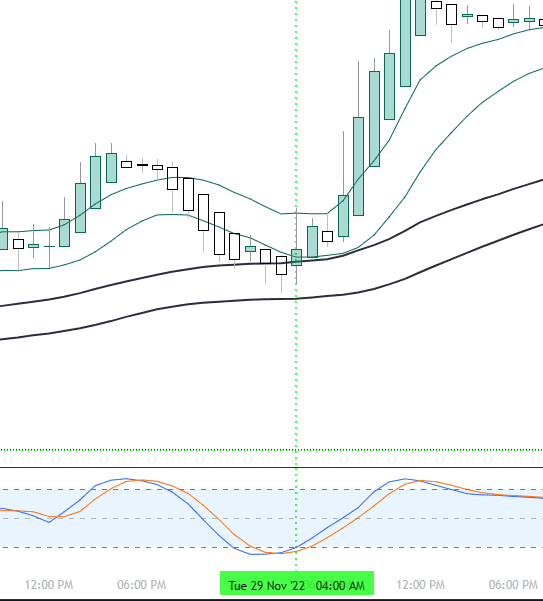
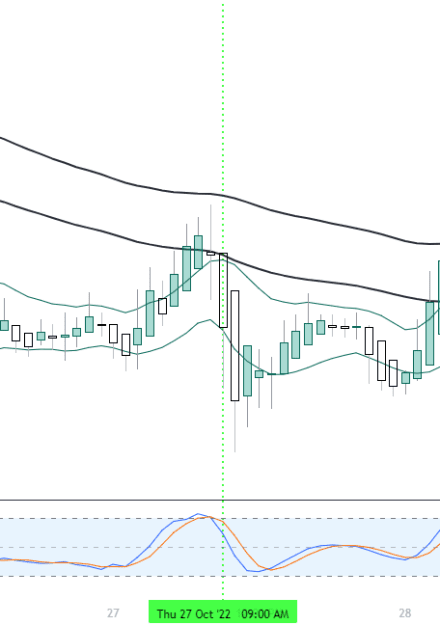
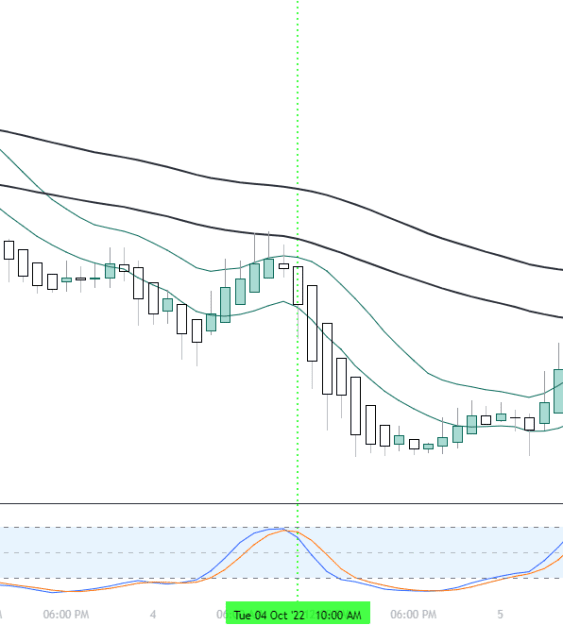
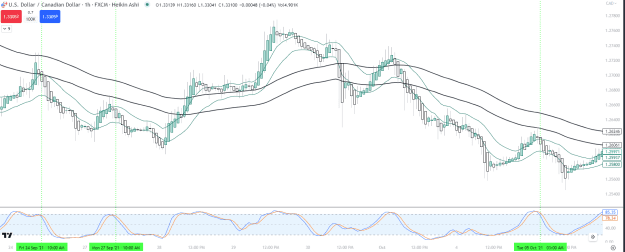
I like this because it's straightforward. When I put these indicators on a chart, it looks clean and easy to follow.
It goes like this.
//| 1) Create two pairs of moving average indicators as follows:
//| a) 72-period Simple Moving Average of the highs
//| b) 72-period Simple Moving Average of the lows
//| c) 12-period Exponential Moving Average of the highs
//| d) 12-period Exponential Moving Average of the lows
//|
//| This sets up two bands or channels.
//|
//| When the 12-period moving average band sits above the
//| 72-period band, we consider the trend to be up. When this
//| condition holds true, we will only take long trades.
//|
//| When the 12-period moving average band sits below the
//| 72-period band, we consider the trend to be down. When this
//| condition holds true, we will only take short trades.
//|
//| We do not open trades when any parts of the two bands are
//| touching or overlapping.
//|
//| The trade entry signal is the Stochastic indicator with
//| a %K period of 14, a %D period of 3, and a smoothing value
//| of 3.
//|
//| For long trades, we look for the %K value to cross above
//| the %D value after the %K value has dropped below the 65 level.
//|
//| For short trades, we look for the %K line to cross below
//| the %D value after the %K value has risen above the 35 level.
I like this because it's straightforward. When I put these indicators on a chart, it looks clean and easy to follow.
Open to new approaches.