US inflation not as bad as feared, but still too hot
Quarterly inflation data surprised to the upside and led the market to brace for a very unpleasant MoM print today. Thankfully it was due to upward revisions, primarily to January, with the March figure coming in line with initial expectations. Nonetheless, inflation remains too hot and September remains the earliest opportunity for an interest rate cut

US inflation remains hot, but not as hot as feared
So the core PCE deflator has indeed come in at 0.3% month-on-month, with upward revisions to January and February, rather than the 0.48% MoM implied by the quarterly PCE deflator from yesterday, assuming no revisions. In the great scheme of things, inflation was still far too hot in the first quarter, but the monthly profile doesn't look as concerning as it could have done so we are seeing a little bit of a relief rally in Treasuries.
January has been revised from 0.45 to 0.50 and February is now 0.27 rather than 0.26 with March at 0.32. This remains well above the 0.17% MoM we need to average over time to bring the annual rate of inflation back to 2% - basically we need to see the blue bars in the chart below come in below the black line, not above them.
Core personal consumer expenditure deflator - MoM%, 3M annualised% & YoY%
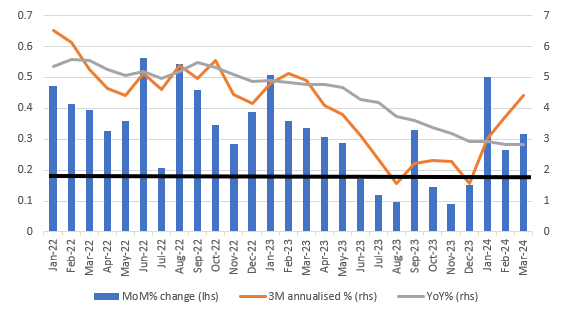
We are of the view that we will see the core PCE deflator average somewhere between 0.2 and 0.3% MoM through 2Q, but there are some economists out there effectively arguing for 0.1-0.2% MoM as an average through the second quarter. Their argument is that inflation is largely down to housing, insurance and medical services - the latter two due to annual price hikes that have a tendency to bump up the numbers in 1Q - so-called residual seasonality - and this will fade in 2Q, which was what we saw happen in 2023. We are a little more wary about making such a call just yet, but we believe that housing should increasingly reflect what is happening in private rents and that will contribute to more modest monthly inflation prints.
Spending fuelled by savings and borrowing, not income
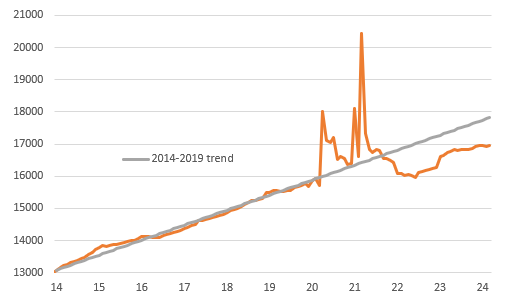
Elsewhere in the report, we see that spending held up well (0.8% MoM versus the 0.6% MoM consensus) so this provides a solid base for 2Q annualised consumer spending growth. However, the savings rate continues to fall - it was at 4.1% in January and is now 3.2%. The average over the past 20 years is 5.9%. Real household disposable income is still effectively flatlining so growth is being driven by lower savings and more borrowing.
Real household disposable income levels $mn
Remember that the top 20% of US households by income spend the same amount of money as the bottom 60% of households by income. The top 20% are doing very well with good, high-paying jobs, tending to own their own home (largely with low long-term mortgage rates) and can make 4% in money market funds while feeling the benefits of higher stock and home prices. The bottom 60% are feeling more stress with far less wealth exposure. They are more likely to rent and are more likely to have exhausted pandemic-era-accrued savings. The key question for the spending and growth in general is how long that top 20% can keep offsetting intensifying stresses faced by the bottom 60%. We see the story moving in the direction of weaker spending as we head through the rest of the year.
This publication has been prepared by ING solely for information purposes irrespective of a particular user's means, financial situation or investment objectives. The information does not constitute investment recommendation, and nor is it investment, legal or tax advice or an offer or solicitation to purchase or sell any financial instrument. Read more