
Advertisement
Advertisement
USD/JPY Forecast: Wage Hikes in Japan to Drive BoJ’s Exit from Negative Rates
By:
Key Points:
- The USD/JPY gained 0.48% on Tuesday, closing the session at 147.644.
- Bank of Japan views on the economy and US inflation numbers contributed to the gains.
- On Wednesday, updates from wage negotiations in Japan could impact bets on a March BoJ pivot from negative rates.

In this article:
USD/JPY Movement on Tuesday
The USD/JPY gained 0.48% on Tuesday. Reversing a 0.08% loss from Monday, the USD/JPY ended the session at 147.644. The USD/JPY fell to a low of 146.618 before rising to a Tuesday session high of 148.163.
Wage Negotiations in the Spotlight
On Wednesday, wage negotiations between Japanese companies and the unions will take center stage. The outcome of the negotiations will influence the timeline for a BoJ pivot from negative rates.
A marked increase in wages would increase disposable income. Higher disposable income could fuel household spending and demand-driven inflation. The BoJ needs household spending and the services sector to build demand-driven inflationary pressures. In response, the BoJ could exit negative rates to deliver price stability.
Rengo, the Japanese Trade Union Confederation (JTUC), will publish the first set of wage agreements on Friday, March 15. Importantly, Rengo releases the first report before the start of the Bank of Japan monetary policy meeting on March 18. Substantial pay hikes could fuel bets on a March BoJ exit from negative rates.
With wage negotiations in focus, investors must consider BoJ chatter. Views on wage negotiations and the timeline to exit negative rates would move the dial.
Fed Rate Cut Bets, Producer Prices, and Retail Sales
US inflation numbers for February reduced bets on an H1 2024 Fed rate cut. According to the CME FedWatch Tool, the chance of a 25 basis point May rate cut fell from 18.0% to 15.5% on Tuesday. However, the probability of a 25-basis point June rate cut remained above 50%, falling from 59.6% to 57.1%.
The CME figures reflected investor hopes of softer wage growth and inflation figures for March. Recent US labor market-related data suggested weaker conditions despite a 275k jump in nonfarm payrolls. Job openings trended lower, and the unemployment rate rose, with wage growth slowing.
Weaker labor market conditions could impact wage growth, consumer confidence, and spending on non-essential items.
US producer prices and retail sales figures on Thursday could reflect the effects of weaker labor market conditions on demand. Conversely, upward producer prices and retail sales trends may delay the timeline for a Fed rate cut. A higher-for-longer Fed rate path could impact disposable income and curb consumer spending.
There are no US economic indicators for investors to consider on Wednesday. However, the US CPI Report and anticipation of the Thursday numbers could influence buyer demand for the US dollar.
Short-term Forecast
Near-term trends for the USD/JPY will hinge on wage negotiations in Japan. Substantial wage hikes could drive bets on a March BoJ pivot from negative rates. Weaker US economic indicators could support bets on a June Fed rate hike and a USD/JPY fall toward 140.
USD/JPY Price Action
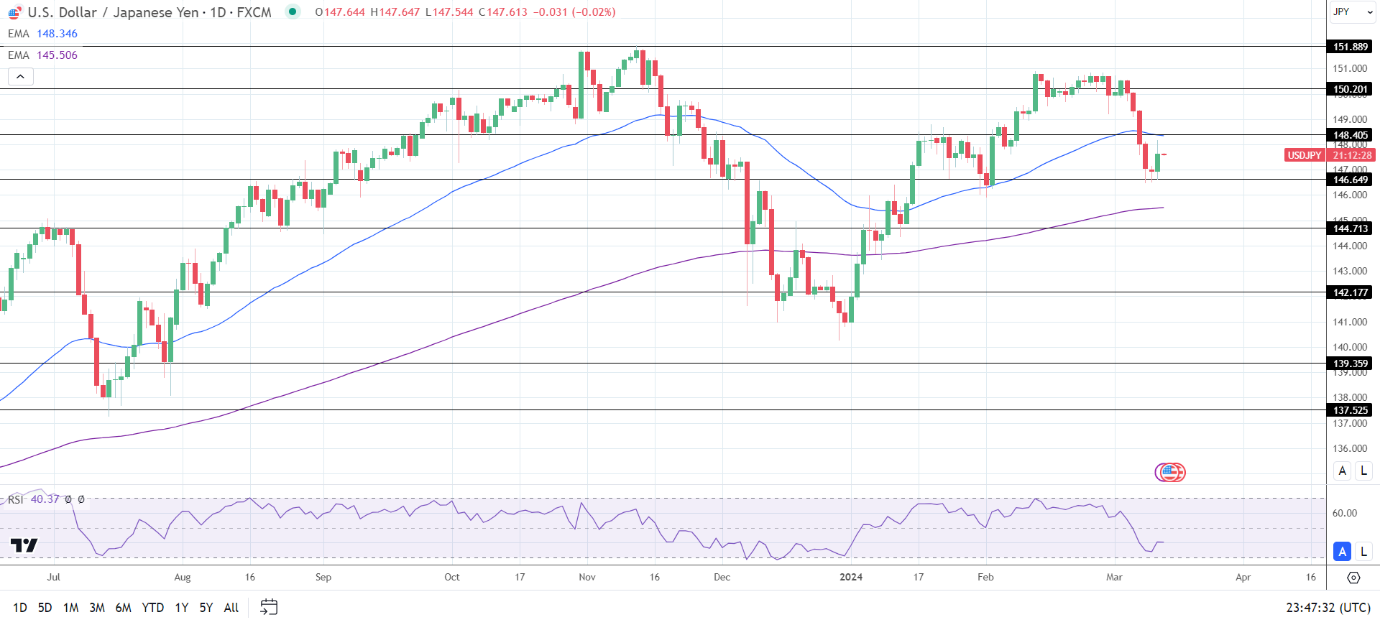
Daily Chart
The USD/JPY remained below the 50-day EMA while holding above the 200-day EMA, sending bearish near-term but bullish longer-term price signals.
A break above the 50-day EMA and the 148.405 resistance level would support a move toward the 150.201 resistance level. However, selling pressure could intensify at the 148.405 resistance level. The 50-day EMA is confluent with the resistance level.
Updates from Japan on wage negotiations and BoJ chatter need consideration.
Failure to break above the 50-day EMA would leave the USD/JPY under selling pressure. A fall below the 146.649 support level would give the bears a run at the 200-day EMA.
The 14-day RSI at 40.37 suggests a USD/JPY fall to the 200-day EMA before entering oversold territory.
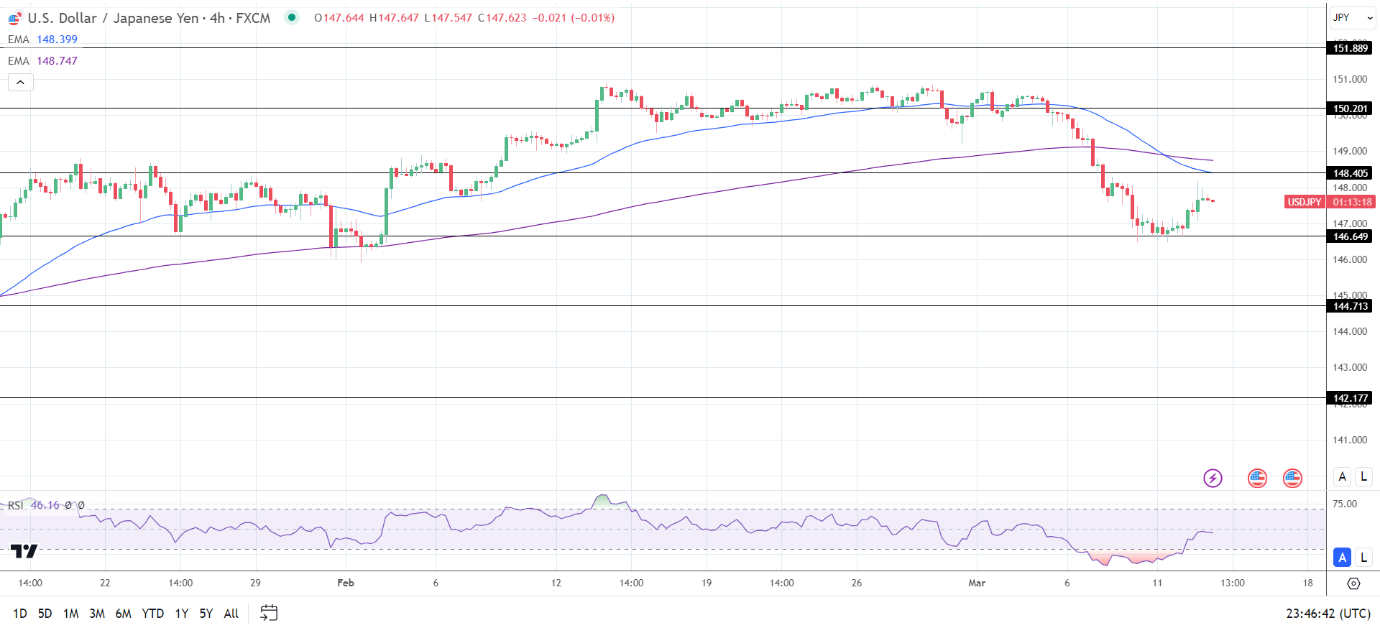
4-Hourly Chart
The USD/JPY hovered below the 50-day and 200-day EMAs, confirming the bearish near-term price trends.
A USD/JPY break above the 50-day EMA and the 148.405 resistance level would give the bulls a run at the 200-day EMA.
However, a drop below the 147 handle would bring the 146.649 support level into play.
The 14-period 4-hour RSI at 46.16 suggests a USD/JPY fall to the 146.649 support level before entering oversold territory.
About the Author
Bob Masonauthor
With over 20 years of experience in the finance industry, Bob has been managing regional teams across Europe and Asia and focusing on analytics across both corporate and financial institutions. Currently he is covering developments relating to the financial markets, including currencies, commodities, alternative asset classes, and global equities.
Did you find this article useful?
Latest news and analysis


Advertisement