
Advertisement
Advertisement
USD/JPY Forecast: BoJ Exit Strategy Sparks Interest Amid Recession Concerns
By:
Key Points:
- The USD/JPY declined by 0.05% on Monday, ending the session at 150.108.
- Bank of Japan chatter and investors bets on a pivot from negative rates to influence morning trends.
- Fed commentary and the CB Leading Economic Index also warrant investor attention later in the session.

In this article:
USD/JPY Movement on Monday
The USD/JPY declined by 0.05% on Monday. Partially reversing a 0.20% gain from Friday, the USD/JPY ended the day at 150.108. The USD/JPY rose to a high of 150.192 before falling to a Monday session low of 149.873.
Bank of Japan and the Exit from Negative Rates
Last week, Q4 GDP numbers revealed the Japanese economy fell into a technical recession. Despite the weaker-than-expected Q4 GDP numbers, investors expect the Bank of Japan to pivot from negative rates.
Economists remained focused on forward-looking indicators and the spring wage negotiations. Private consumption contributed to the unexpected economic contraction. The GDP numbers will likely increase the focus on wage growth and household spending trends.
BoJ Governor Kazuo Ueda and Deputy Governor Shinichi Uchida recently laid out exit strategies from negative rates. Significantly, Governor Ueda left a BoJ pivot on the table despite the economy falling into a technical recession. The comments aligned with the view the BoJ will likely exit negative rates if wage negotiations meet expectations.
On Tuesday, there are no economic indicators from Japan to consider, leaving BoJ chatter to move the dial. Support for an April pivot from negative rates could impact buyer demand for the USD/JPY.
US Economic Calendar: CB Leading Economic Index and Fed Speakers in Focus
On Tuesday, the CB Leading Economic Index will be under the spotlight. Economists forecast the Index to decline by 0.3% in January after falling by 0.1% in December.
A larger-than-expected fall may influence investor bets on an H1 2024 Fed rate cut. In contrast to the Michigan Consumer Sentiment numbers, the Conference Board signaled weak consumer confidence in December. Warnings of a mild recession could impact buyer demand for the USD/JPY.
Recent inflation and labor market data reduced bets on the Fed cutting interest rates in March or May. A deteriorating macroeconomic environment could refuel bets on a May rate cut.
Beyond the numbers, investors must also consider FOMC member comments. Reactions to the recent inflation numbers and views on interest rate cuts would move the dial.
Short-term Forecast
Near-term trends for the USD/JPY remain hinged on the Bank of Japan and Fed commentary. Expectations of a BoJ pivot from negative rates remain a headwind for the USD/JPY. Nonetheless, sticky US inflation and US labor market conditions would leave interest rate differentials firmly in favor of the US dollar. The BoJ recently warned monetary policy would remain accommodative after exiting negative rates.
USD/JPY Price Action
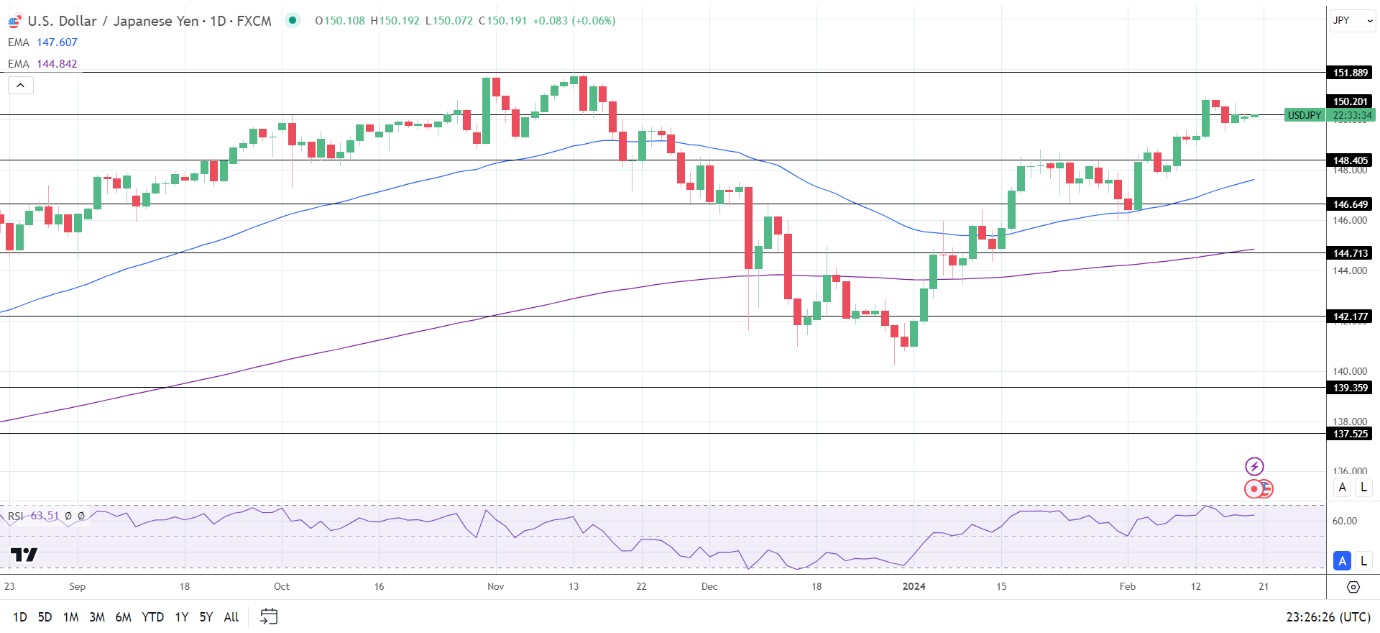
Daily Chart
The USD/JPY held well above the 50-day and 200-day EMAs, sending bullish price signals.
A USD/JPY break above the 150.201 resistance level would support a move to the 151.889 resistance level.
Bank of Japan commentary, intervention warnings, US data, and Fed speakers need investor consideration.
However, a drop below the 150 handle would bring the 148.405 support level into play.
The 14-day RSI at 63.51 indicates a USD/JPY move to the 151 handle before entering overbought territory.
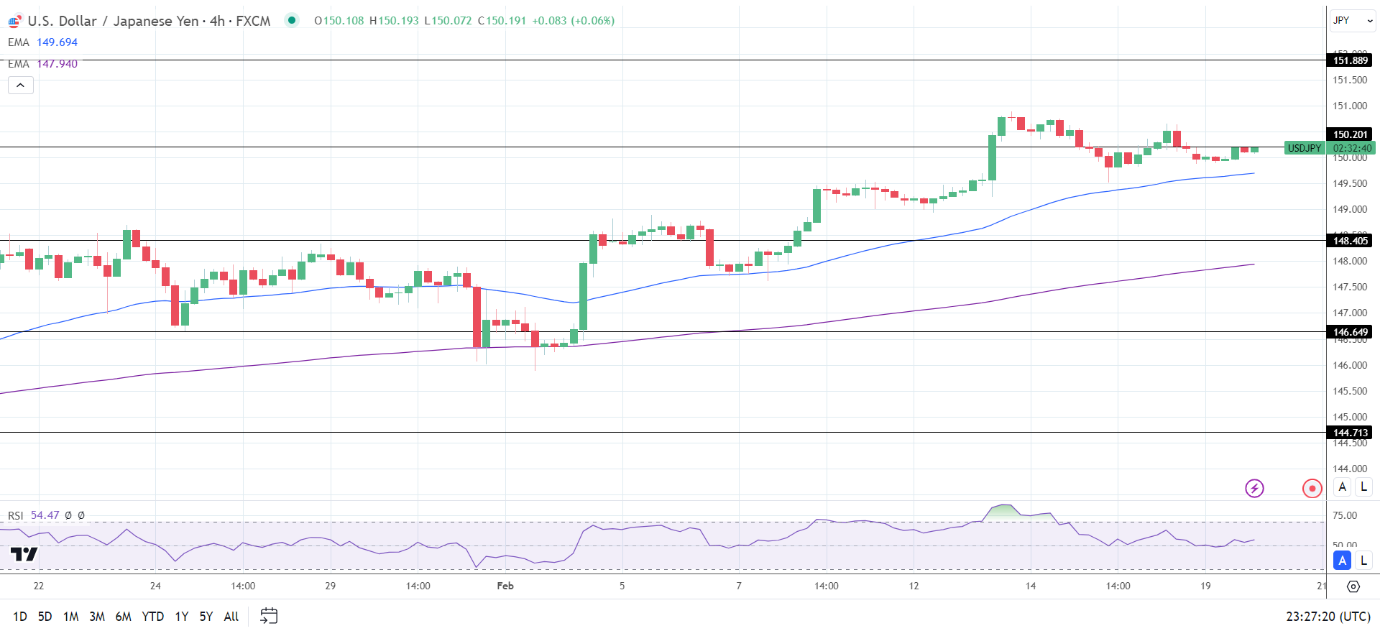
4-Hourly Chart
The USD/JPY remained above the 50-day and 200-day EMAs, reaffirming the bullish price signals.
A USD/JPY breakout from the 150.201 resistance level would support a move to the 151.889 resistance level.
However, a fall through the 50-day EMA would give the bears a run at the 148.405 support level.
The 14-period 4-hour RSI at 54.47 indicates a USD/JPY move to the 151 handle before entering overbought territory.
About the Author
Bob Masonauthor
With over 20 years of experience in the finance industry, Bob has been managing regional teams across Europe and Asia and focusing on analytics across both corporate and financial institutions. Currently he is covering developments relating to the financial markets, including currencies, commodities, alternative asset classes, and global equities.
Did you find this article useful?
Latest news and analysis


Advertisement