
Advertisement
Advertisement
AUD to USD Forecast: Balancing Act of RBA and US Economic Trends
By:
Beijing stimulus chatter and US private sector PMIs hold the key for Aussie Dollar's next move on the charts.

In this article:
Highlights
- The AUD/USD gained 0.21% on Thursday, ending the session at $0.65558.
- Bets on a more hawkish RBA rate path and a weaker US dollar countered disappointing Australian PMI numbers.
- On Friday, stimulus news from Beijing and US private sector PMIs need consideration.
Thursday Overview of the AUD/USD
The AUD/USD gained 0.21% on Thursday. Reversing a 0.21% loss from Wednesday, the Aussie dollar ended the day at $0.65558. The Aussie dollar fell to a low of $0.65346 before rising to a high of $0.65747.
Hawkish RBA Bets, and China Stimulus
Private sector PMI numbers from Thursday highlighted the balancing act the RBA currently faces. A more marked contraction across the private sector impacted buyer demand for the Aussie dollar.
However, the PMI survey also revealed a pickup in price pressures. Notably, input prices, fueled by energy, labor, and currency conversion costs, point to an acceleration in consumer price inflation. The inflation outlook suggests the need for a more hawkish RBA rate path to dampen demand-driven inflationary pressures.
Beyond the economic calendar, stimulus chatter from Beijing also needs consideration. One-third of Australian exports go to China. Stimulus measures would drive demand, supporting the Australian economy and the Aussie dollar. Australia has a trade-to-GDP ratio above 50%.
There are no economic indicators from Australia for investors to consider on Friday.
US Private Sector PMIs in the Spotlight
Preliminary US private sector PMIs for November will garner investor interest on Friday. Recent economic indicators fueled Fed policy uncertainty. While inflationary pressures softened, US labor market conditions remained tight.
Private sector PMIs could give the markets more clues on near-term price and consumption trends. The US Services PMI will likely impact Fed interest rate bets. The services sector contributes more than 70% to the US economy and drives inflationary pressures.
Better-than-expected numbers could ease bets on a May Fed rate cut. However, the devil will be in the details. Price and employment subcomponents need consideration. A pickup in price pressures and staffing levels would suggest the need to keep rates higher for longer.
Short-Term Forecast
Monetary policy divergence remains tilted toward the Aussie dollar. US private sector PMIs could materially influence views on a May Fed rate cut. In contrast, recent Australian economic indicators support a more hawkish RBA rate path. Stimulus measures from Beijing could be another tailwind for the Aussie dollar.
AUD/USD Price Action
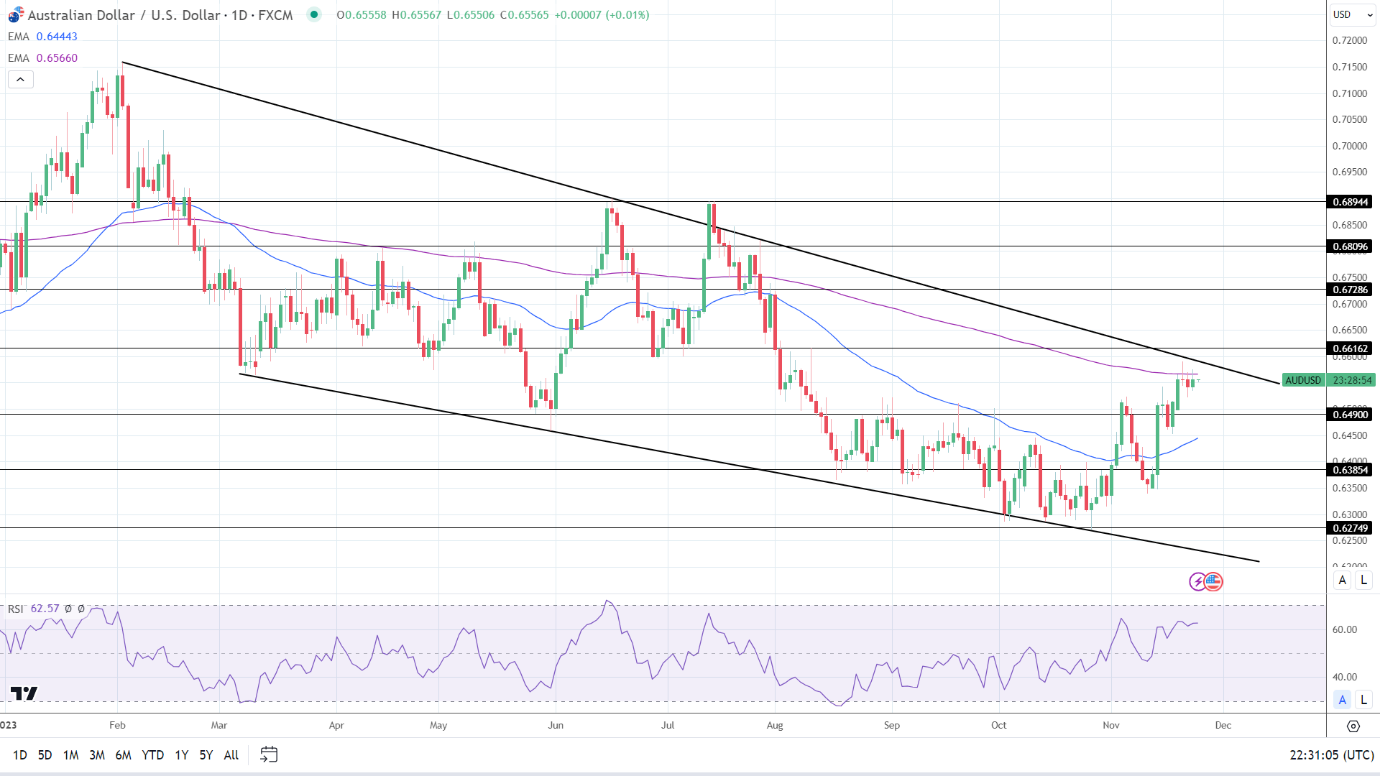
Daily Chart
The AUD/USD remained above the 50-day EMA while hovering below the 200-day, sending bullish near-term but bearish longer-term price signals.
An AUD/USD move through the 200-day EMA would support a break above the trend line to target the $0.66162 resistance level.
Market risk sentiment and US private sector PMIs will influence buyer demand for the Aussie dollar.
However, a fall through the $0.65220 handle would give the bears a run at the $0.64900 support level.
A 14-period Daily RSI reading of 62.57 indicates a move to the trend line before entering overbought territory (typically above 70 on the RSI scale).
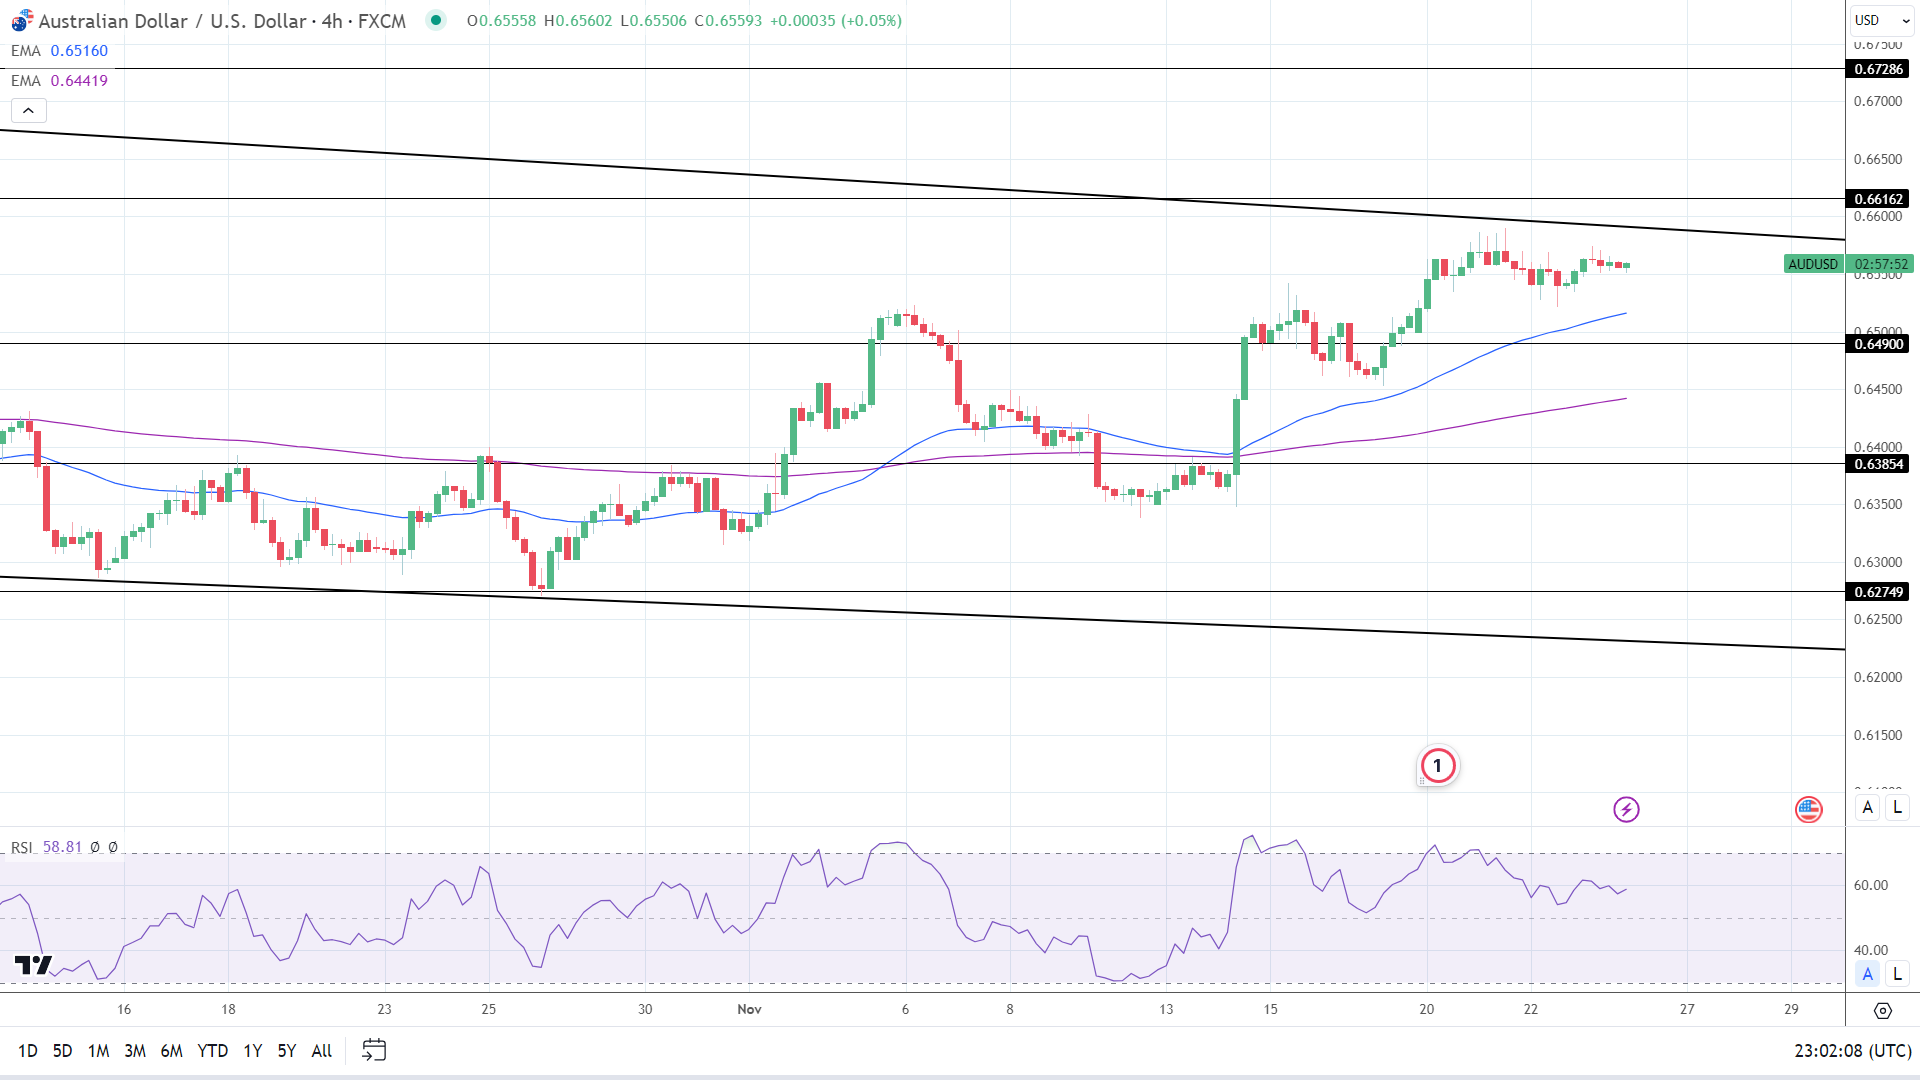
4-Hourly Chart
The AUD/USD holds above the 50-day and 200-day EMAs, affirming bullish price signals.
An AUD/USD break above the trend line would support a move to the $0.66162 resistance level.
However, a fall through the $0.65220 handle would give the bears a run at the 50-day EMA. A drop below the 50-day EMA would bring the $0.64900 support level into view.
The 14-period 4-Hourly RSI at 58.81 indicates an AUD/USD break above the trend line before entering overbought territory.
About the Author
Bob Masonauthor
With over 20 years of experience in the finance industry, Bob has been managing regional teams across Europe and Asia and focusing on analytics across both corporate and financial institutions. Currently he is covering developments relating to the financial markets, including currencies, commodities, alternative asset classes, and global equities.
Did you find this article useful?
Latest news and analysis


Advertisement