

Friday Speedrun: October 27, 2023
Friday Speedrun: October 27, 2023
Bill Ackman stabs dragon in face

Hello. It’s Friday. Thanks for signing up. I’m Brent Donnelly.
The About Page for Friday Speedrun is here.

Here’s what you need to know about markets and macro this week
Global Macro
The fragility of the bond market remains the main theme this week as we made new highs in yields very early on and then noted bond short Bill Ackman tweeted he’s out and yields went whoosh. The entire week’s range in US 10-year yields was printed from 7am NY on Monday to 3am that night. Since then, we have had some good economic news from the US and quite a lot of bad earnings news from Europe but it all came out as a wash.
Stocks took out all the big levels as the Magnificent 7 lost some of their magnificence on bad earnings from Google and momentum-driven selling. Stocks like NVDA, trading at 30X sales, are pure momentum trades. They keep going up until they stop going up and there is no need to concoct a fundamental story around the price movements. Much of the time, it’s purely endogenous momentum.
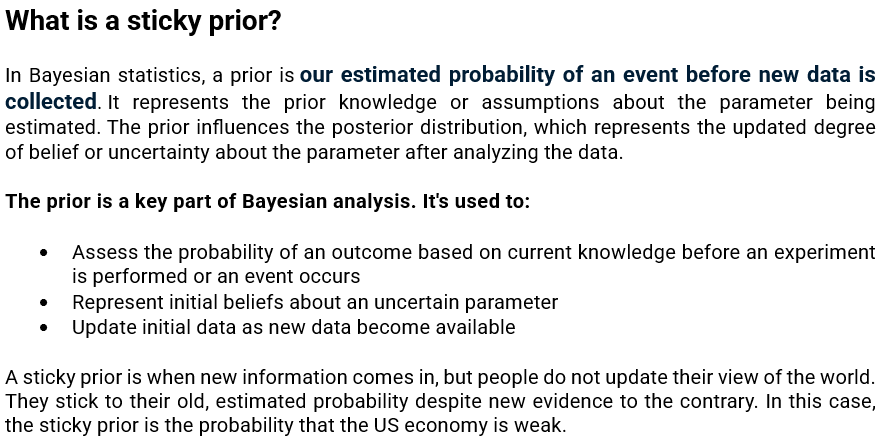
Reactions to yesterday’s US GDP release were interesting as it was all about sticky priors as the bulls saw more evidence of a strong US economy while bears saw an unsustainable spike that sets the stage for weakness ahead. Blaming Taylor Swift as a way to cope with strong US data and maintain a bearish outlook is as 2023 as it gets.

Of course, this scoffing dismissiveness was the case last quarter, too.
There are always reasons to fear the end of the cycle, especially when real rates are on the moon.
These sticky priors will obviously be right at some point, but the UAW strike, student loan restart, and government shutdown stories are not quite delivering the pain the way they looked like they might. And Amazon’s earnings release last night doesn’t really help the “US consumer is dying” narrative.
Next week is ginormous for macro with the Fed, BOJ, ISM, NFP, and a Treasury Refunding announcement plus more.
Stocks
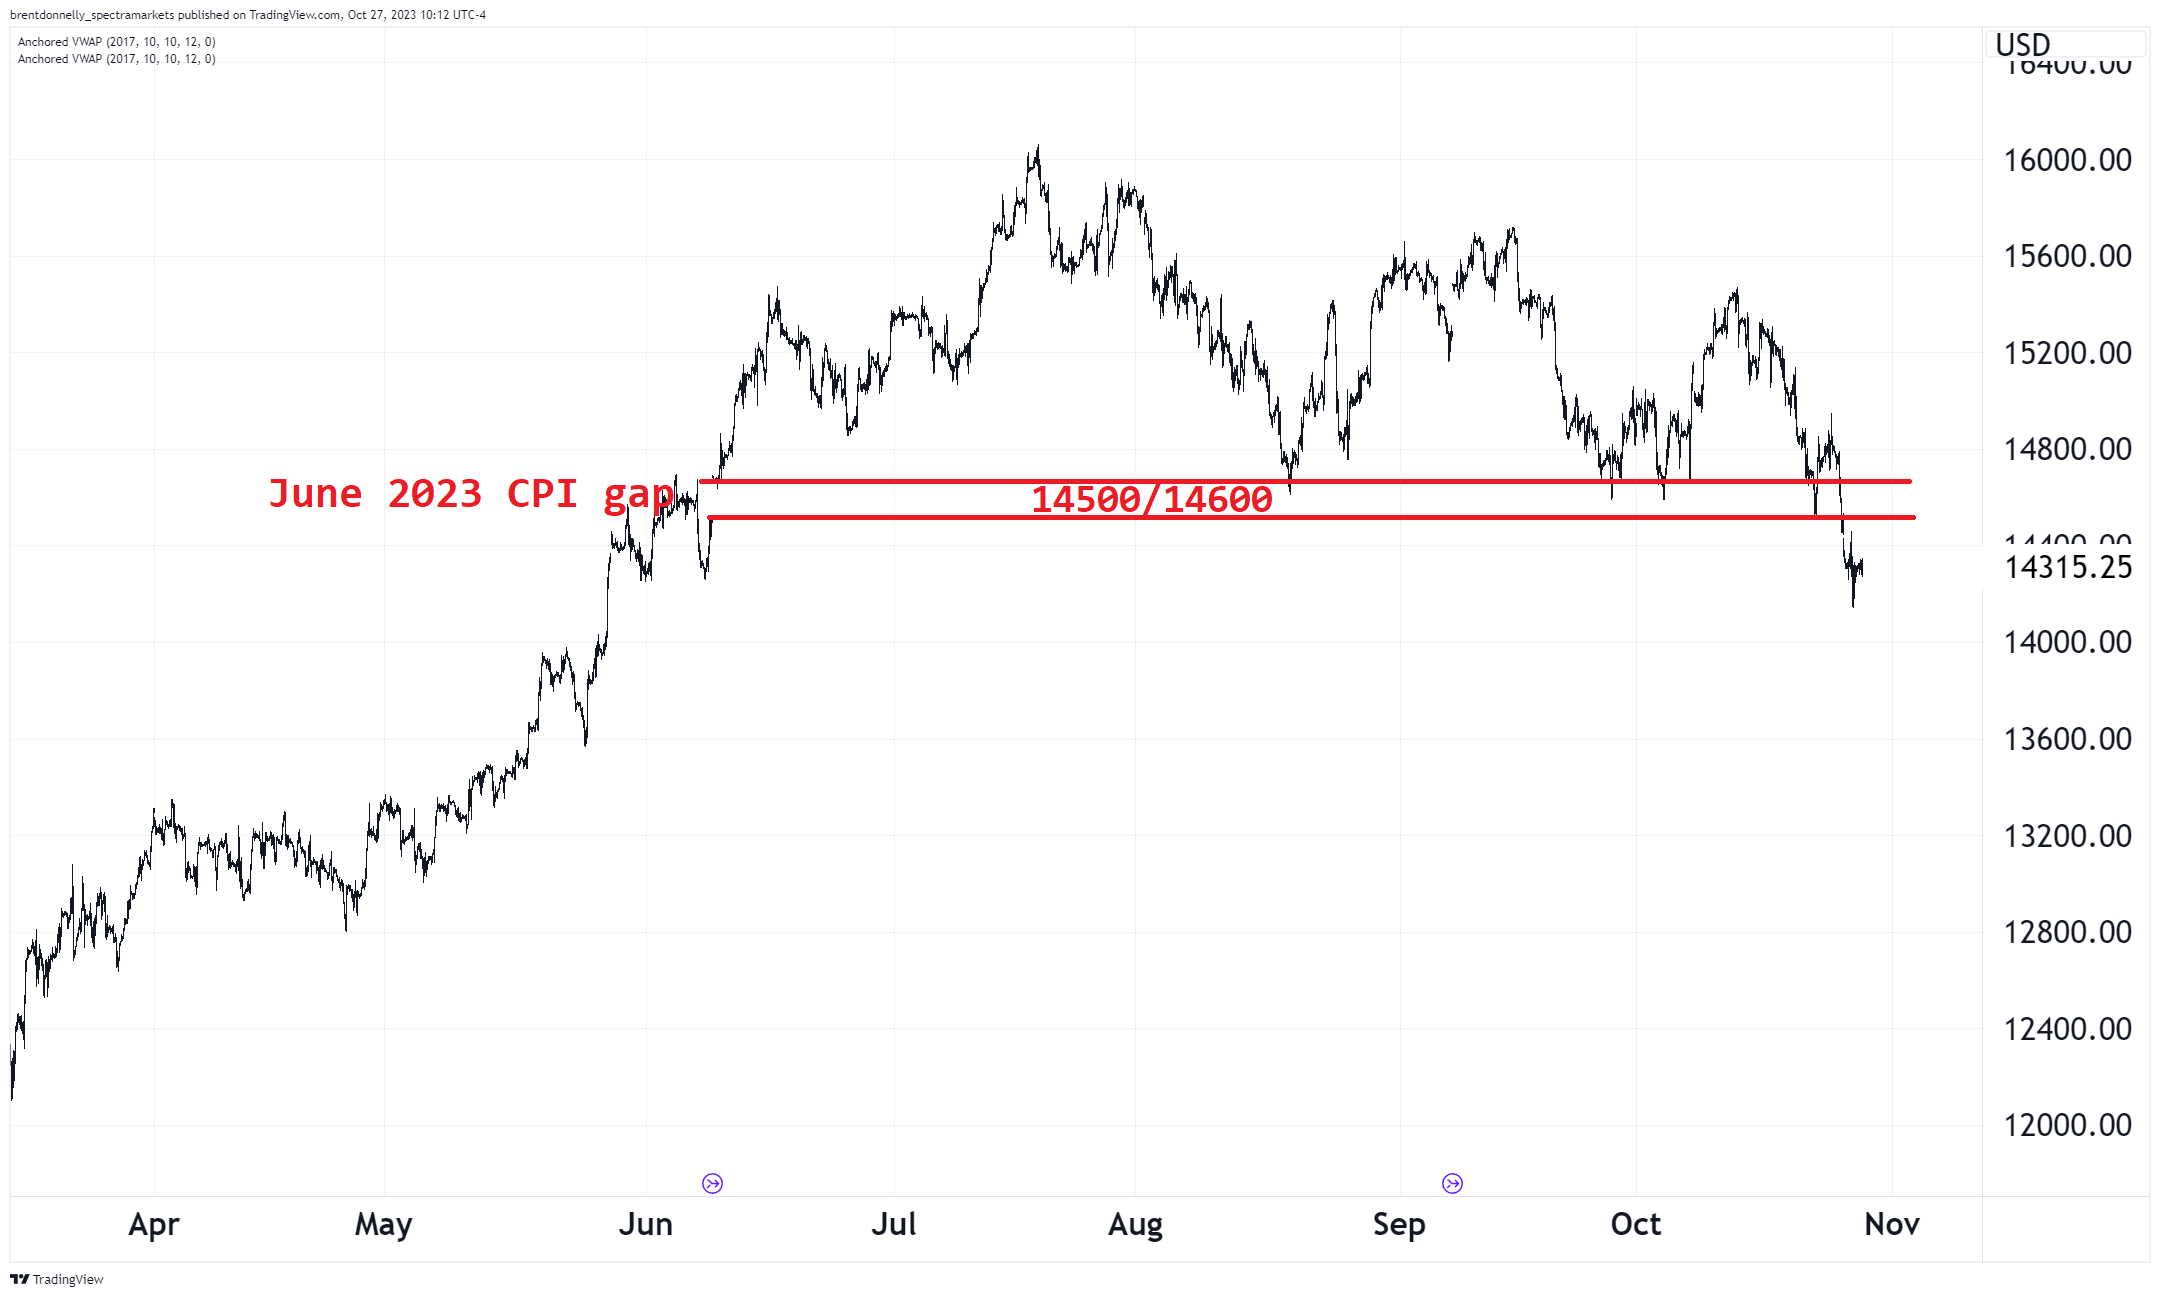
Stocks are not happy. The NASDAQ broke down cleanly through the June CPI gap. The move in yields triggered a turn in momentum and that negative momentum now has a bit of a life of its own. Yesterday, despite calm in bonds, the NASDAQ kept heading south.
NASDAQ hourly, March 2023 to now
The S&P 500 looks similar.
SPX daily, early 2022 to now

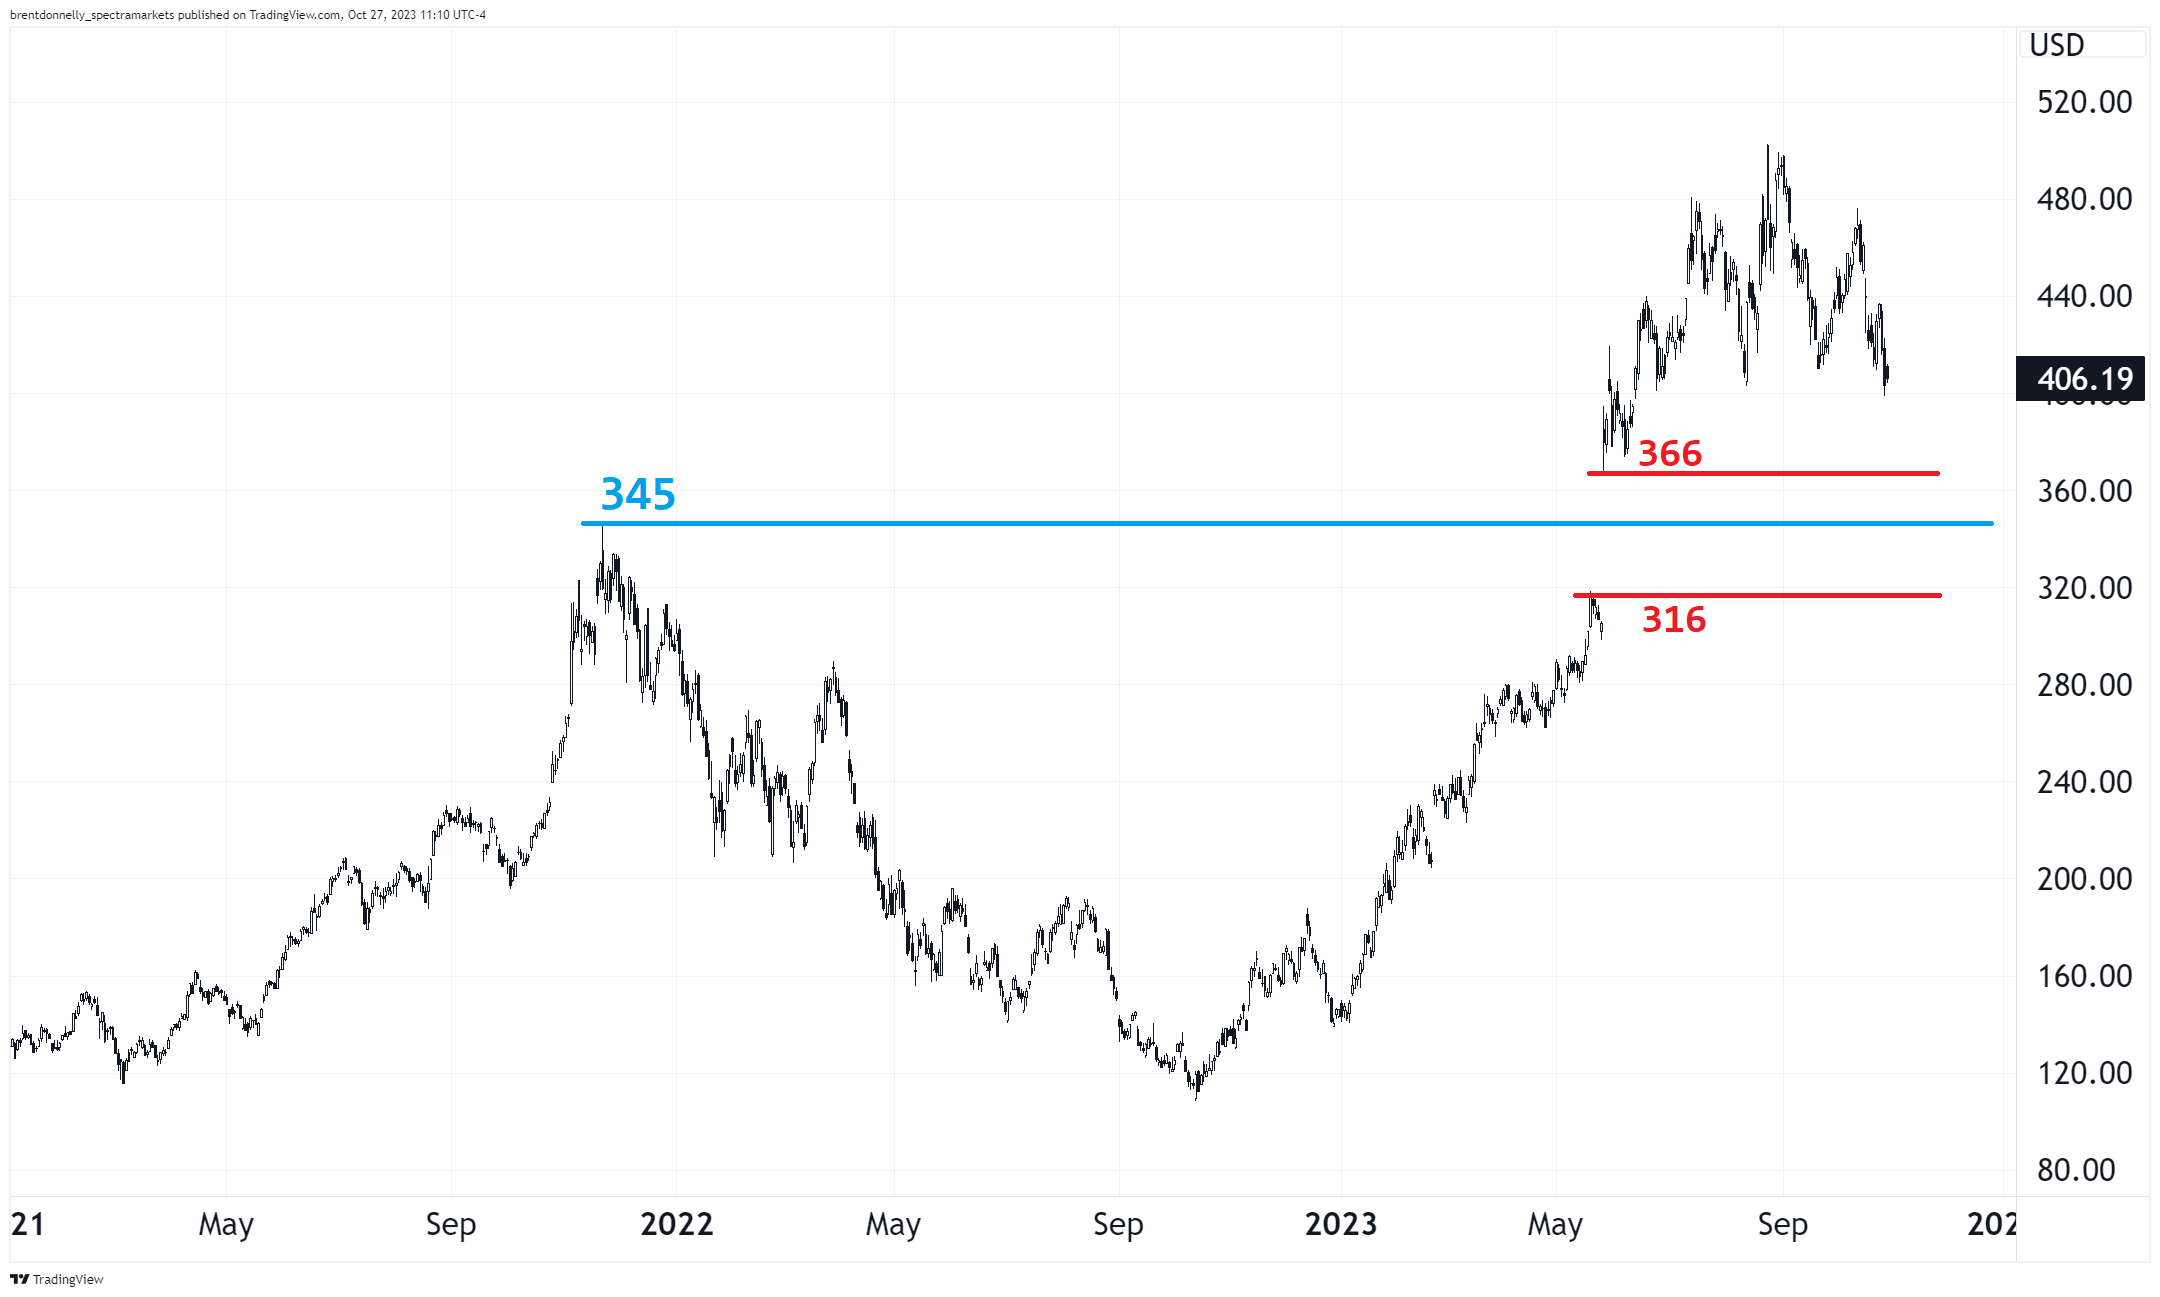
And our old friend Nvidia. I include it only because it’s one of the most interesting and weird-looking charts you could imagine. Such a beautiful island formation up there. A lot of open air in that 316/366 zone probably makes it interesting to assume non-normal acceleration if 365 breaks. This kind of stuff can be useful when picking strikes for options strategies. I’m not saying to buy puts; I’m saying if you are buying puts, you should consider that 366-316 zone as a juicy one and own 360s but sell 320s etc.
NVDA daily chart back to 2021
Here is this week’s 14-word stock market summary: NASDAQ is down two percent but it feels more like five for some reason.
Interest Rates
The bond market was in a bit of a panic last week as the market did a poor job of absorbing supply, but this week started off with a BANG as renowned hedge fund manager Bill Ackman took profit on a well-advertised short bond position.
US 10-year yield, 5-minute chart with Ackman tweet marked
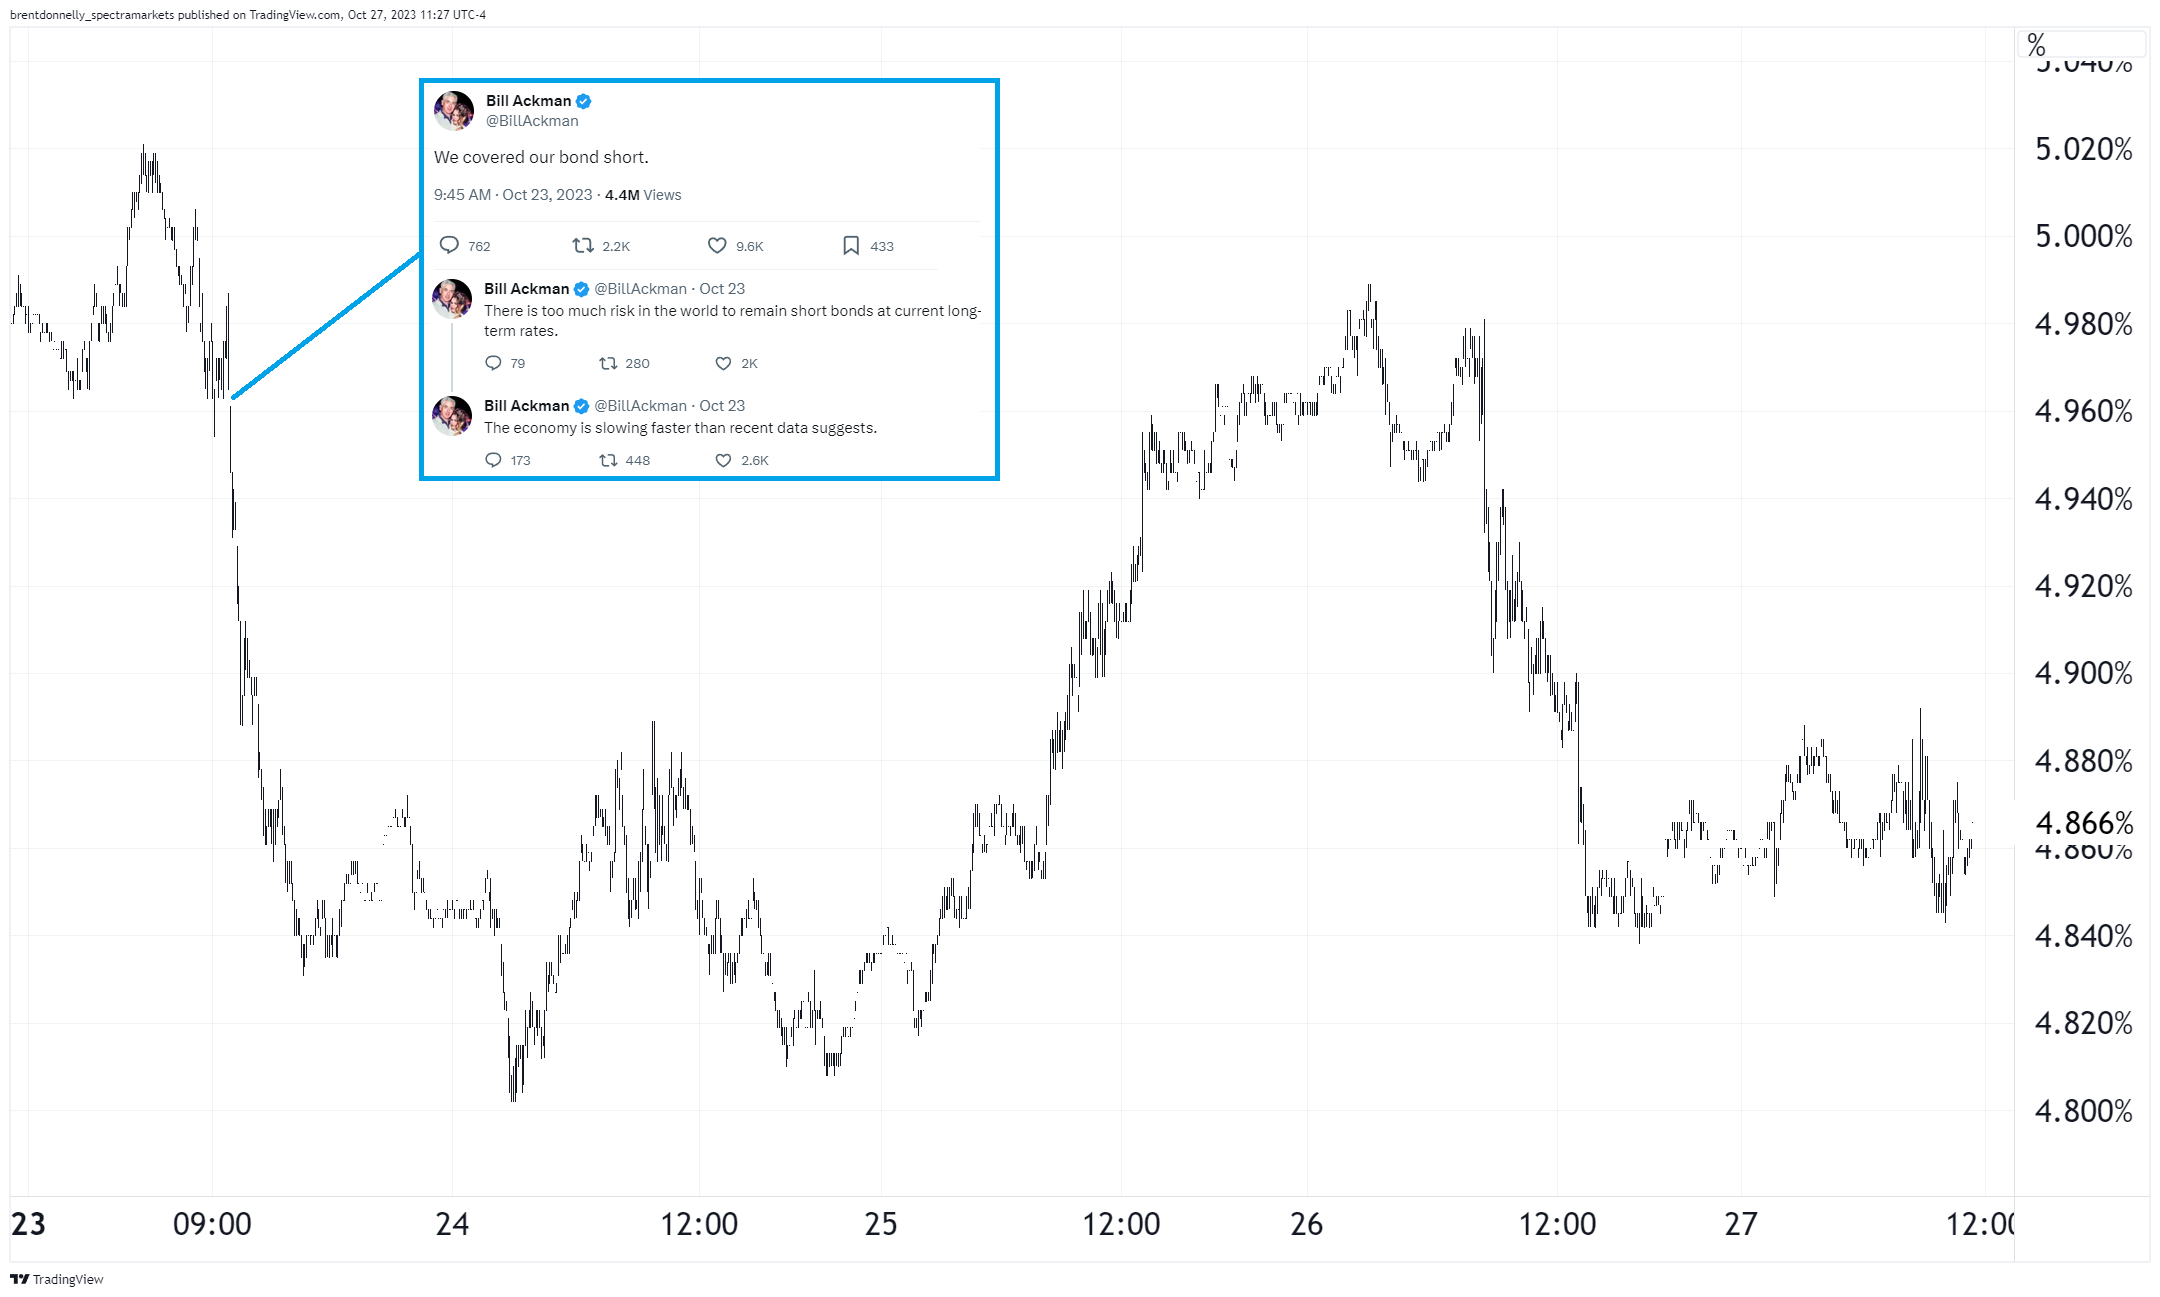
Can one person move the market this much? Absolutely. It’s often a combination of a person having some respect from the market, and that side of the market already being the weak side. In other words, yields probably would have peaked around that time anyway, but Ackman’s tweet affected the timing as it flipped psychology right at the moment weak bond shorts were a bit over their skis.
Momentum is always an important factor in markets and the momentum-killing nature of the Ackman Xeet pretty much killed the yield hysteria like Saint George killed the dragon.

.
Dragons aren’t real. [citation needed]
Fiat Currencies
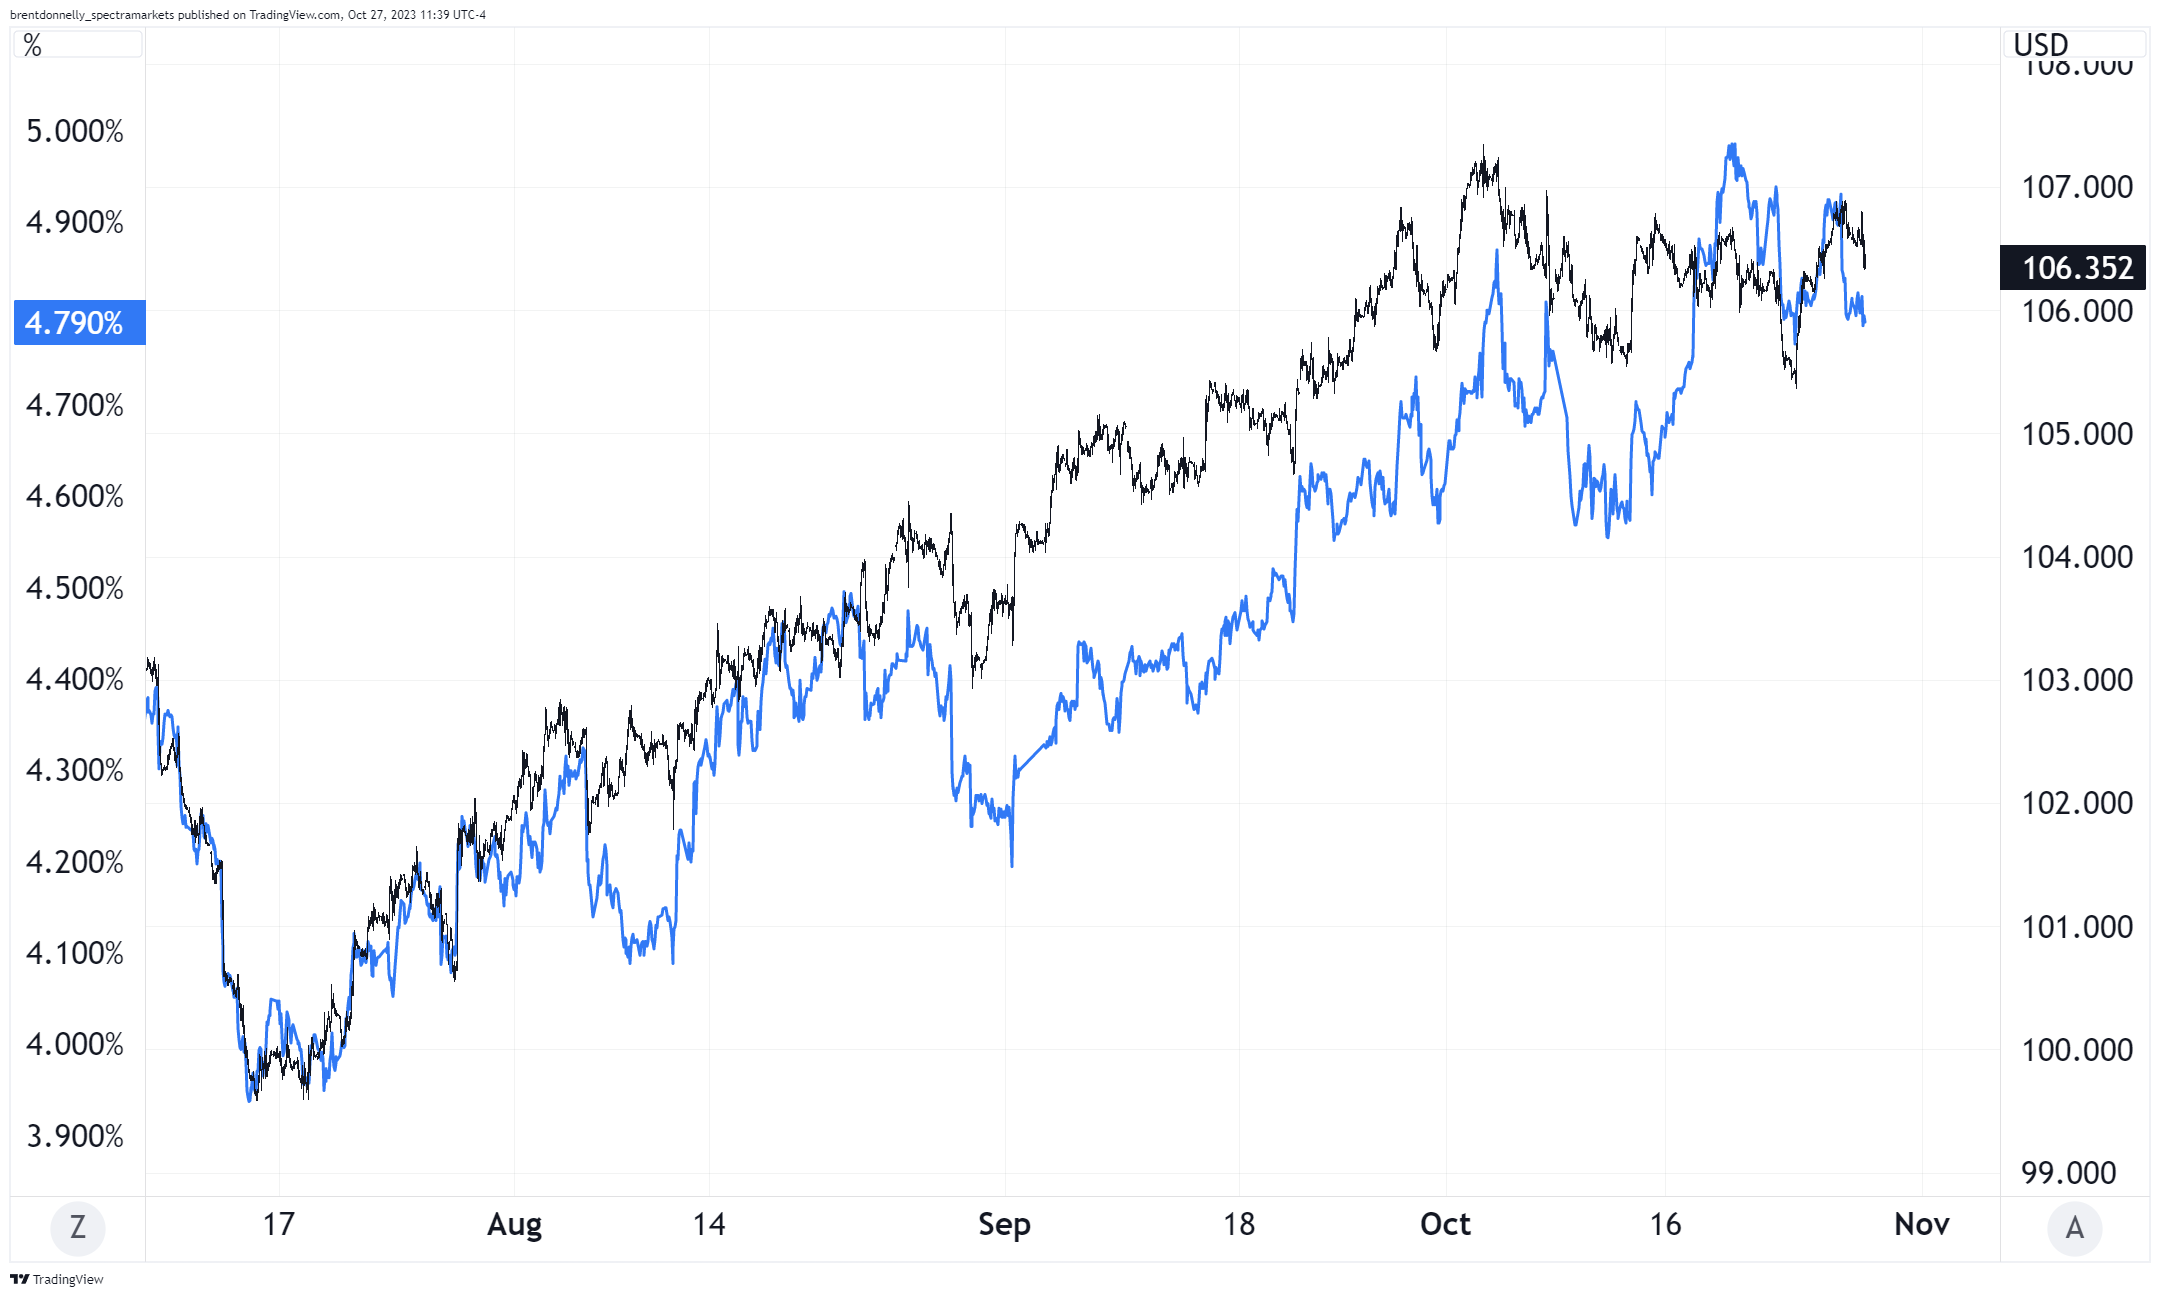
The dollar and US yields are joined at the calf like two participants in a three-legged race.
US Dollar Index (black) and US 5-year yield (blue)

Weary bond traders get no rest next week as the Treasury Refunding Announcement offers clues on supply, while the Bank of Japan, FOMC, ISM, and jobs report offer clues on monetary policy and the US economy. It’s going to be an exciting week.
While the USD is always on the main stage at FXapalooza, the music on the side stages is interesting right now with CAD particularly in the spotlight as The Bank of Canada sounds dovish and the market has turned its evil red eyes back on countries with huge consumer debt burdens and imminent mortgage resets. If you’re trying to play for economic weakness somewhere, Canada and the UK seem like much better targets than the USA.
As perceived prospects for Canada dim, Australia is playing catch up on rates still after staying too low for too long. The number one driver of G10 currency pairs most of the time is the difference in interest rates between the two countries. AUDCAD is reading straight from the textbook here as the currency pair leaps to catch up with the move in rate differentials.
AUDCAD vs. Australia/Canada 5-year interest rate differential
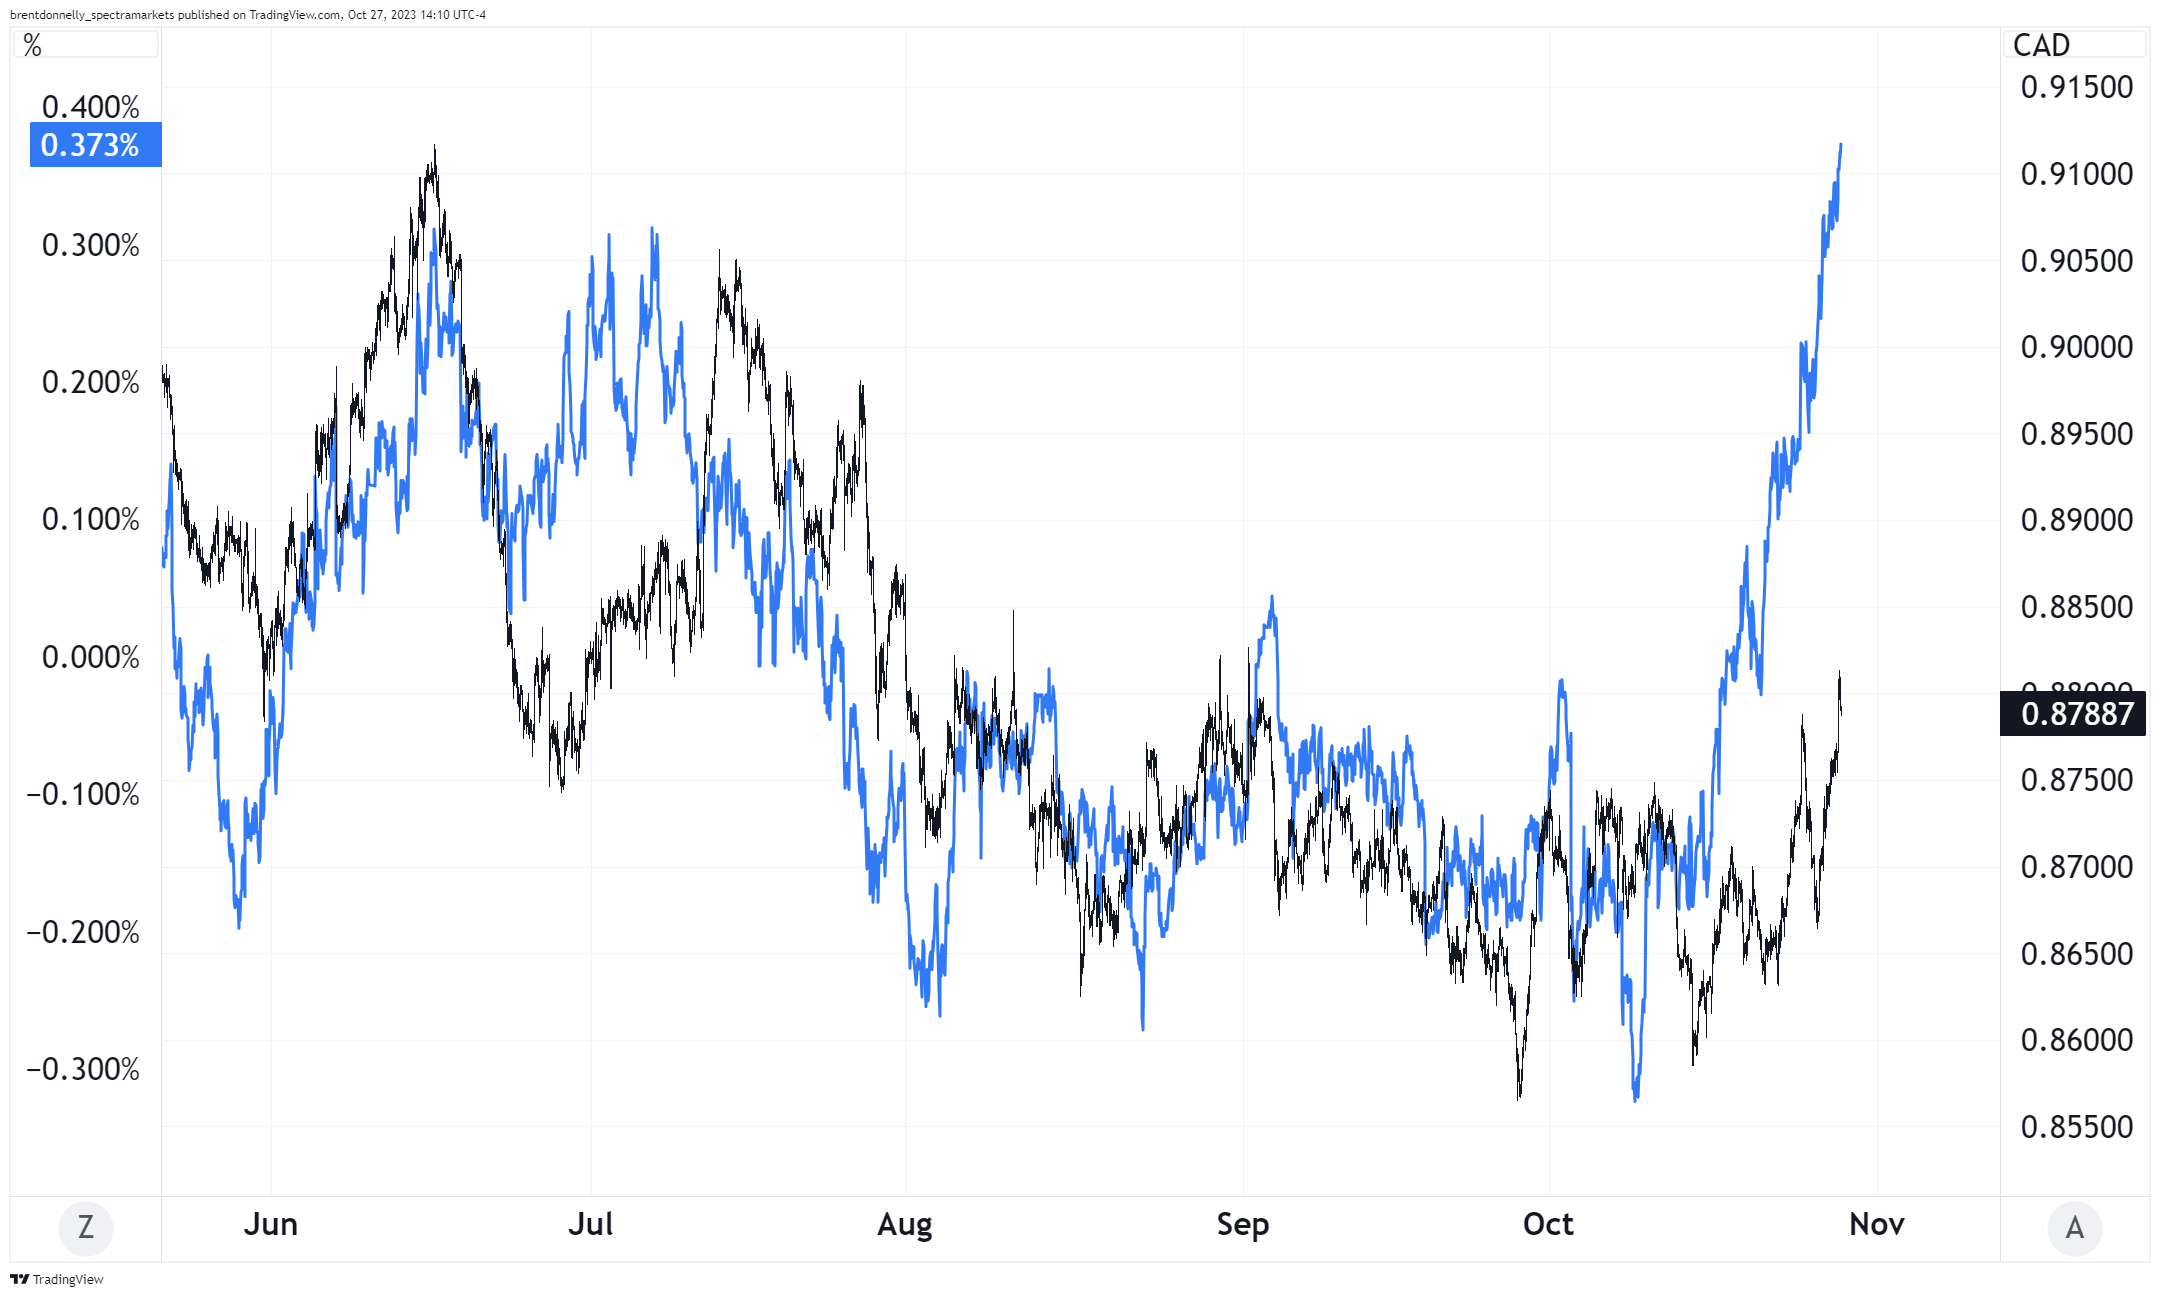
Note how the blue line (yield differential) ripped a few weeks ago and the black line (AUDCAD currency pair) is doing its best to catch up. Trading these leads and lags between correlated variables is called… You guessed it… Lead/lag trading. It’s easier in hindsight as it’s not all science. If someone wrote a book about it, I suppose they might call it: The Art of Currency Trading.
The Bank of Japan is a big deal next week as they have been slow playing the rate hike cycle as everyone else in the world is almost done and they haven’t even started. This has resulted in a disappearing Japanese yen but the authorities there are losing patience with the weakness in the currency. The dream scenario for JPY bulls is the BOJ hikes rates to zero (from current negative levels) and the MOF goes Bret “The Hitman” Hart style and tag teams the market by selling USDJPY via direct intervention.
Dreams sometimes come true!
Crypto
A big week for NGU as the market piled into BTC and alts, anticipating a spot BTC ETF approval and launch by Q1 2024. The easiest way to estimate what is priced in for the spot BTF is to look at the discount on GBTC because if it were convertible to spot, the discount should go to zero. In the past, the premium or discount was a measure of retail supply and demand for bitcoin, but now it’s almost purely a measure of the market’s probability of spot ETF nirvana.
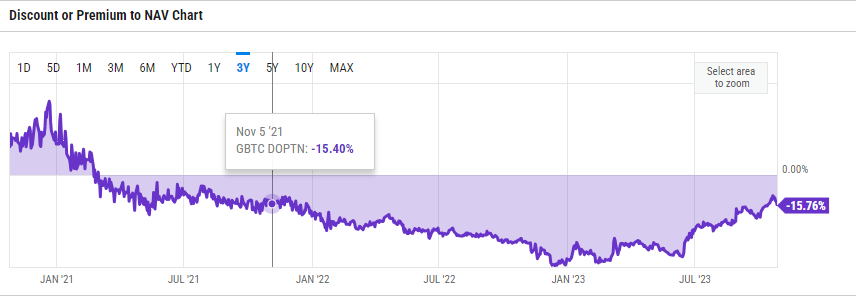
You can’t really say the ETF is FULLY FULLY priced in because if it were, the discount would be much closer to 0%. That said, the contraction from 50% to 16% indicates the launch of the BTC spot ETF will not surprise many people at this point.
Buy the rumor / sell the fact has worked incredibly well in crypto over the past 3 years and this should be no exception. Once the ETF launches, there will probably be more sellers than buyers because it’s not like retail and even retirement fund investors had a shortage of bitcoin products to purchase before this. The speculative buying of BTC into the event is likely to be larger than any mechanical or institutional flow after.
That said, by the time the ETF launches, BTC might be 44k.
Or not.

Commodities
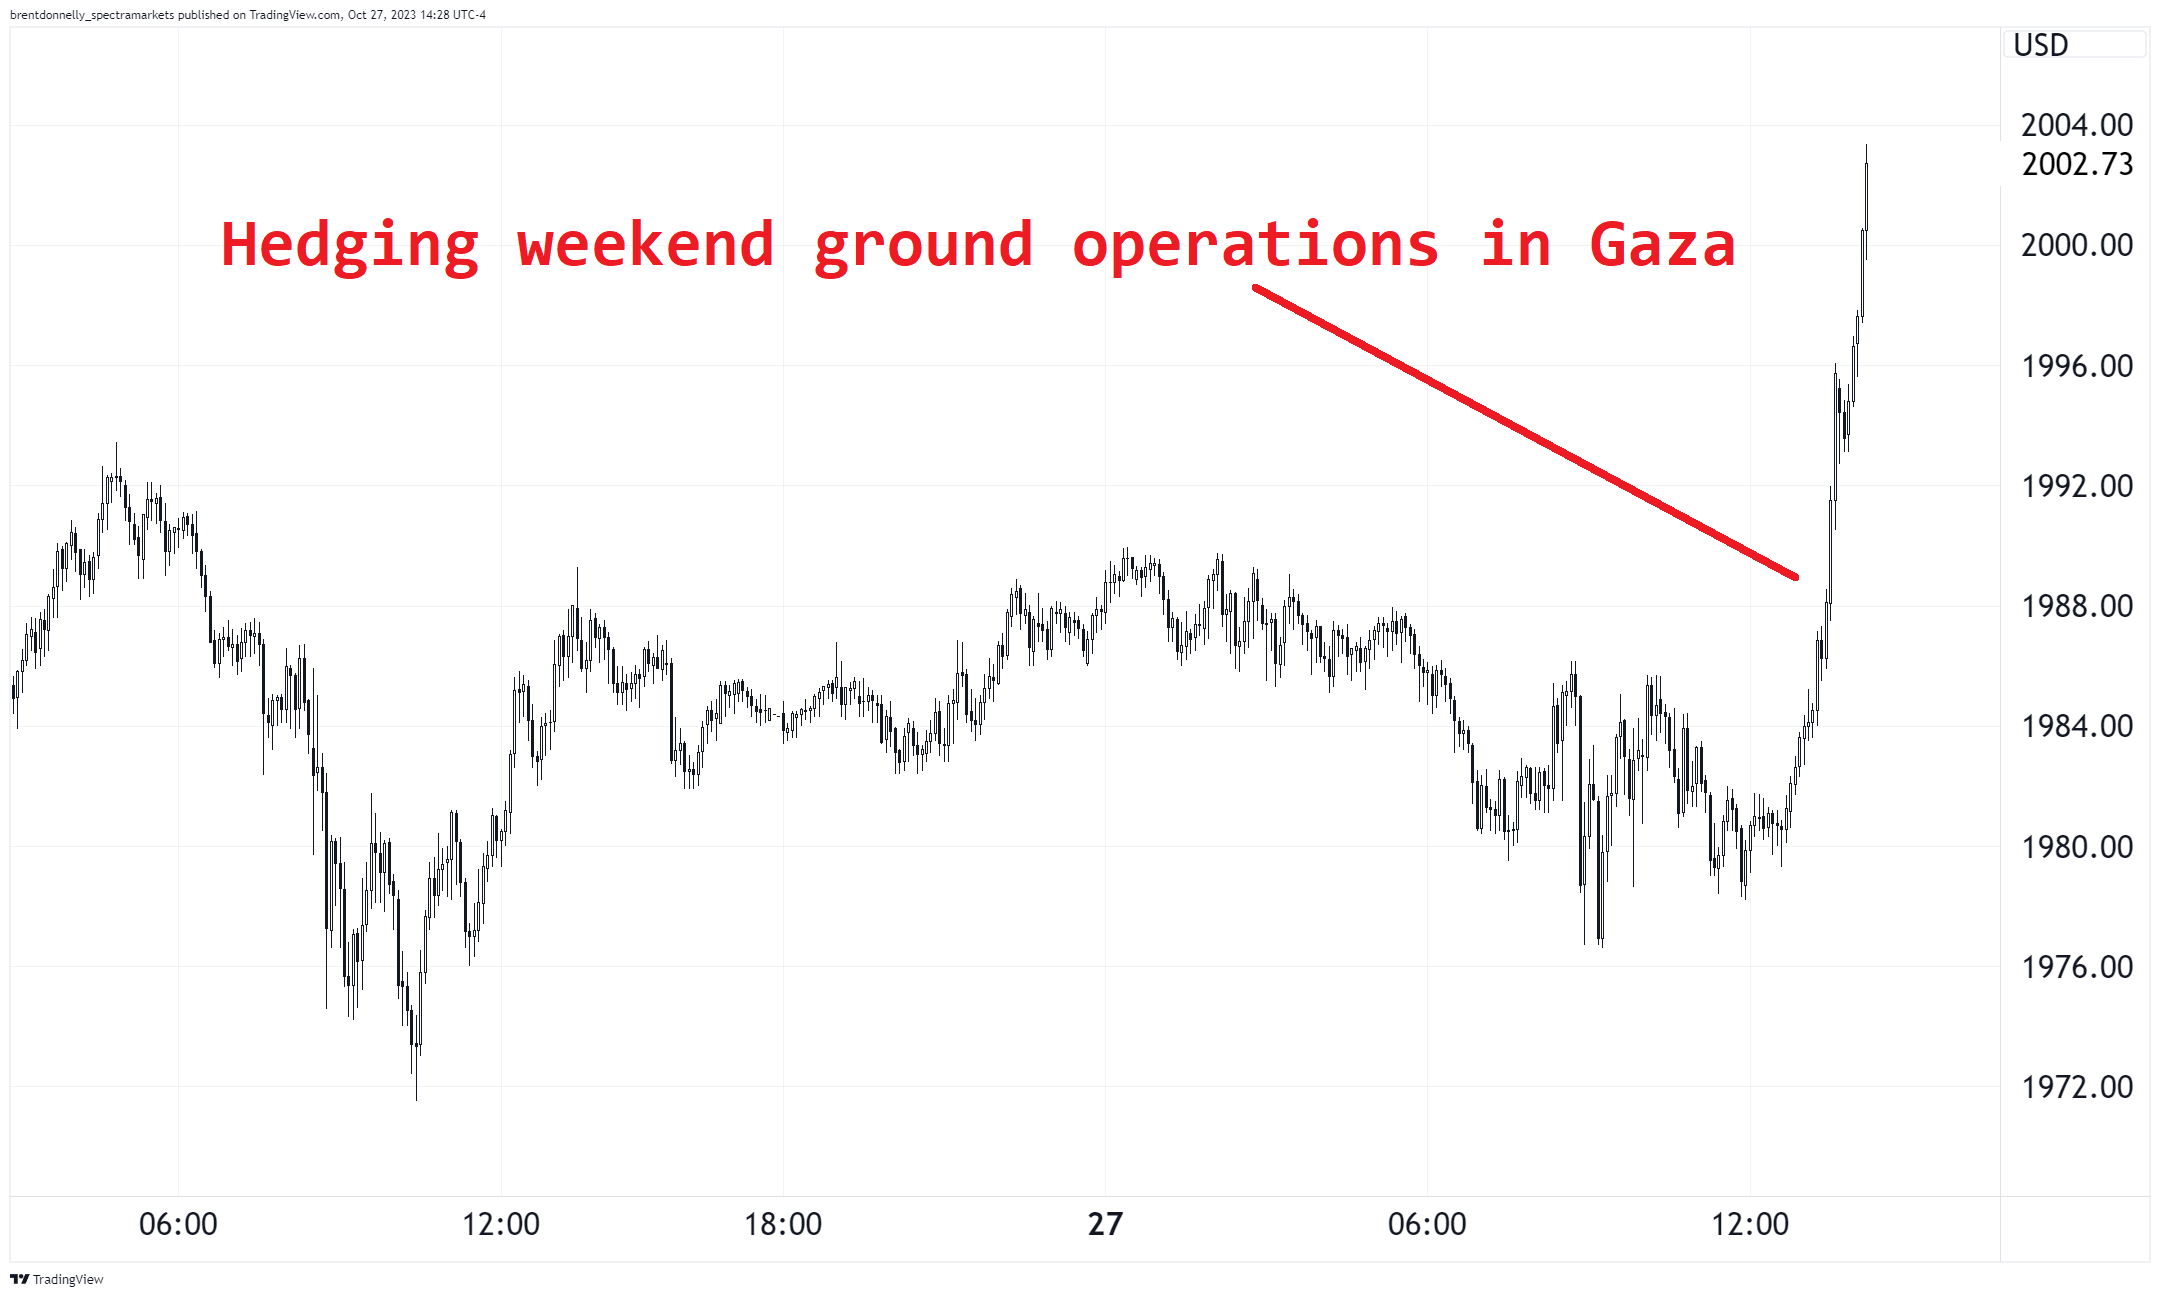
Gold continues to benefit from the shortage of safe havens in the world because bonds are not a safe haven, and neither is the JPY. Those are two of the biggest markets where hedgers use to run when the poop flies through the spinning blades. Without JPY and bonds, you need to buy T-bills, CHF, or gold. Or USD. People are buying some of all of those, but gold is ramping the most. It just broke 2k.
When geopolitics are raging, weekends make people nervous because that’s 48 hours you have to sit there and worry and you can’t hedge. So quite often you will see safe havens rally Friday afternoon as nervous traders and risk managers look at their books and say: “Hmmm, I would like to get some sleep this weekend, let me buy some XAU.”
Gold, 5-minute chart over the last two days
Doctor Copper, normally seen as the PhD in Economics that offers the best guide to global growth, keeps holding the lows despite a balance sheet recession in China, tumbling growth prospects in Europe, and a strong dollar.
Copper triangulation

The huge triangle continues to form while 3.54 (the blue line) has held as major support 4 times now. Indecisive, but maybe basing.
OK! That was 5 minutes. Please share this Substack with any aspiring finance professionals that you know! Thanks!
Get rich or have fun trying.
Links of the week
Interesting / smart
Good longish read on trapped priors.

https://www.wired.com/story/unciphered-ironkey-password-cracking-bitcoin/
Music
This guy is crazy good:
Always enjoy your speedruns!
I was pulling for my #1 team Astros who were defeated by my #2 team Rangers. Texas is back in the World Series again! Go Texas Rangers!