
Advertisement
Advertisement
AUD/USD and NZD/USD Fundamental Analysis: Recovery Mode
By:
It is a quiet start to the week for the AUD/USD and the Kiwi, with no economic indicators to influence, leaving the pairings in recovery mode.

In this article:
Highlights
- The AUD/USD and NZD/USD found support this morning, with the pairings in recovery mode after Friday’s pullback.
- There were no economic indicators this morning to shift investor sentiment.
- However, monetary policy divergence remains in favor of the dollar following Fed Chair Powell’s two days of testimony.
It is a quiet start to the week for the AUD/USD and NZD/USD. There are no economic indicators from Australia or New Zealand to move the dial.
While investors will try to claw back losses from last week, the theme remains the same. Market angst over the economic outlook for China and a hawkish Fed monetary policy outlook remain headwinds for the Aussie and the Kiwi.
Looking forward to the US session, there are no US economic indicators to influence. The lack of economic indicators will leave the pairs in the hands of Fed chatter. Hawkish chatter would pressure the pairings through the afternoon ahead of influential US stats this week.
This morning, bets on a July Fed interest rate hike remained elevated despite manufacturing sector woes. According to the CME FedWatch Tool, the probability of a 25-basis point July Fed rate hike stood at 71.9% versus 74.4% one week ago.
Significantly, the chances of the Fed lifting rates to 5.75% in September stood at 10.1%, up from 8.9% one week earlier. This could change materially with the Core PCE Price Index numbers out on Friday.
AUD/USD Price Action
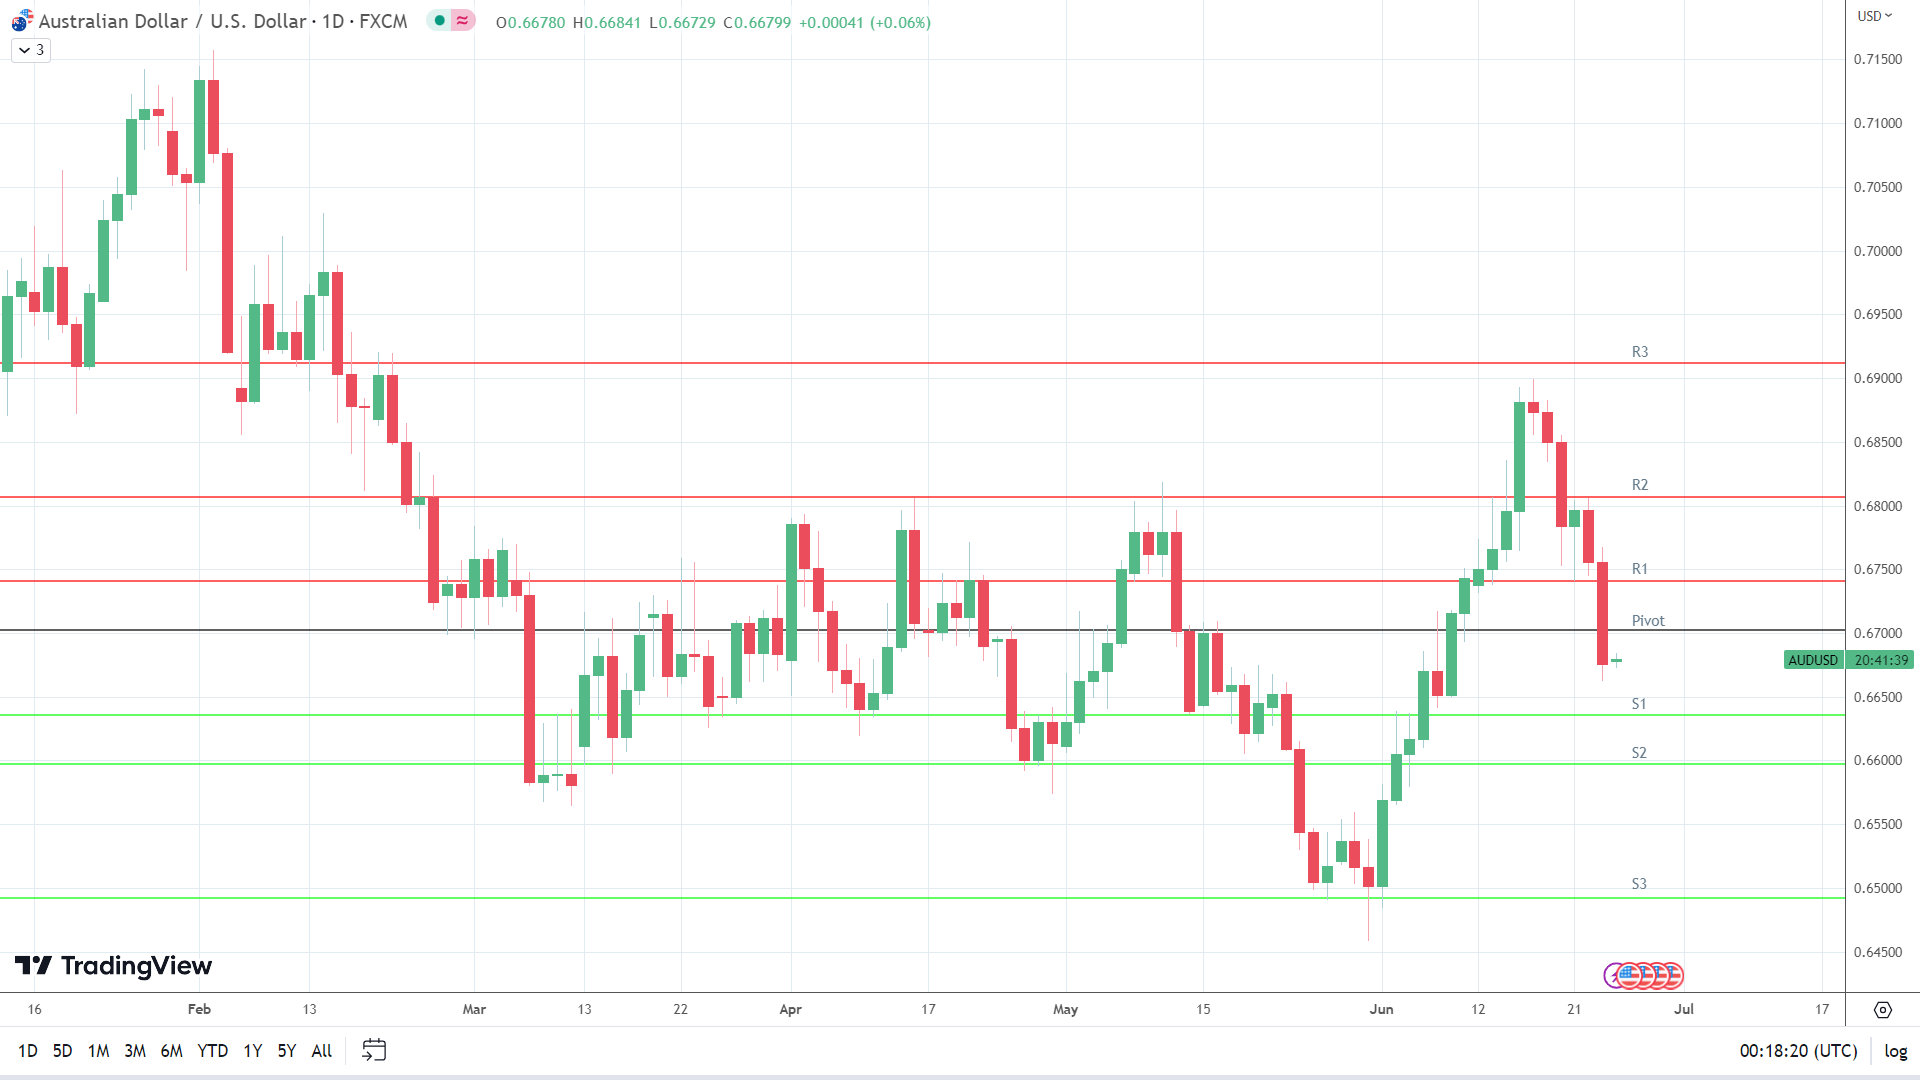
This morning, the AUD/USD was up 0.06% to $0.66799. A mixed start to the day saw the AUD/USD rise to an early high of $0.66841 before falling to a low of $0.66729.
Technical Indicators
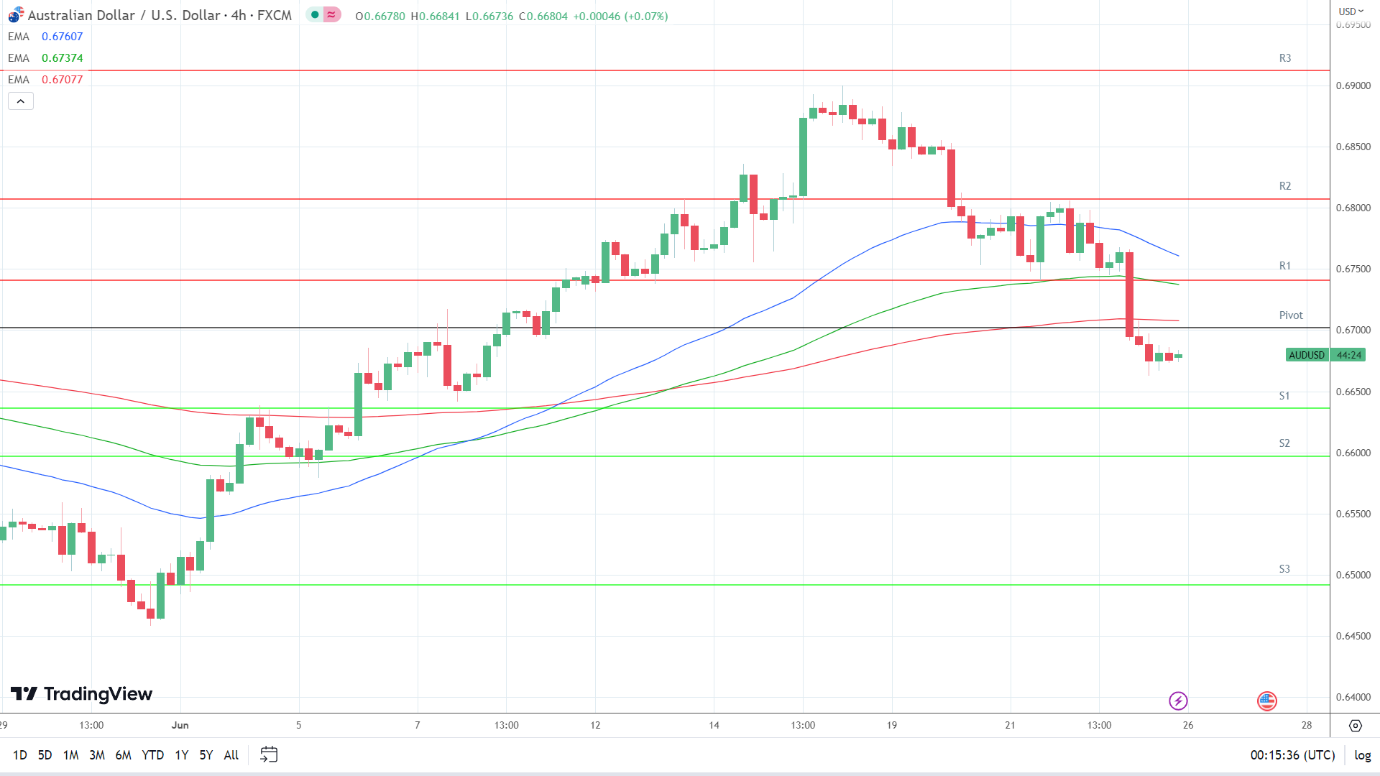
Looking at the EMAs and the 4-hourly chart, the EMAs sent bearish signals. The AUD/USD sat below the 200-day EMA, currently at $0.67077. The 50-day EMA closed in on the 100-day EMA, with the 100-day EMA narrowing to the 200-day EMA, delivering bearish signals.
A move through the 200-day EMA ($0.67077) would support a breakout from the 100-day EMA ($0.67374) and R1 ($0.6741) to give the bulls a run at the 50-day EMA ($0.67607). However, failure to move through the 200-day EMA ($0.67077) would leave S1 ($0.6636) in view. An AUD/USD move through the 50-day EMA would send a bullish signal.
Resistance & Support Levels
| R1 – $ | 0.6741 | S1 – $ | 0.6636 |
| R2 – $ | 0.6807 | S2 – $ | 0.6597 |
| R3 – $ | 0.6912 | S3 – $ | 0.6492 |
NZD/USD Price Action
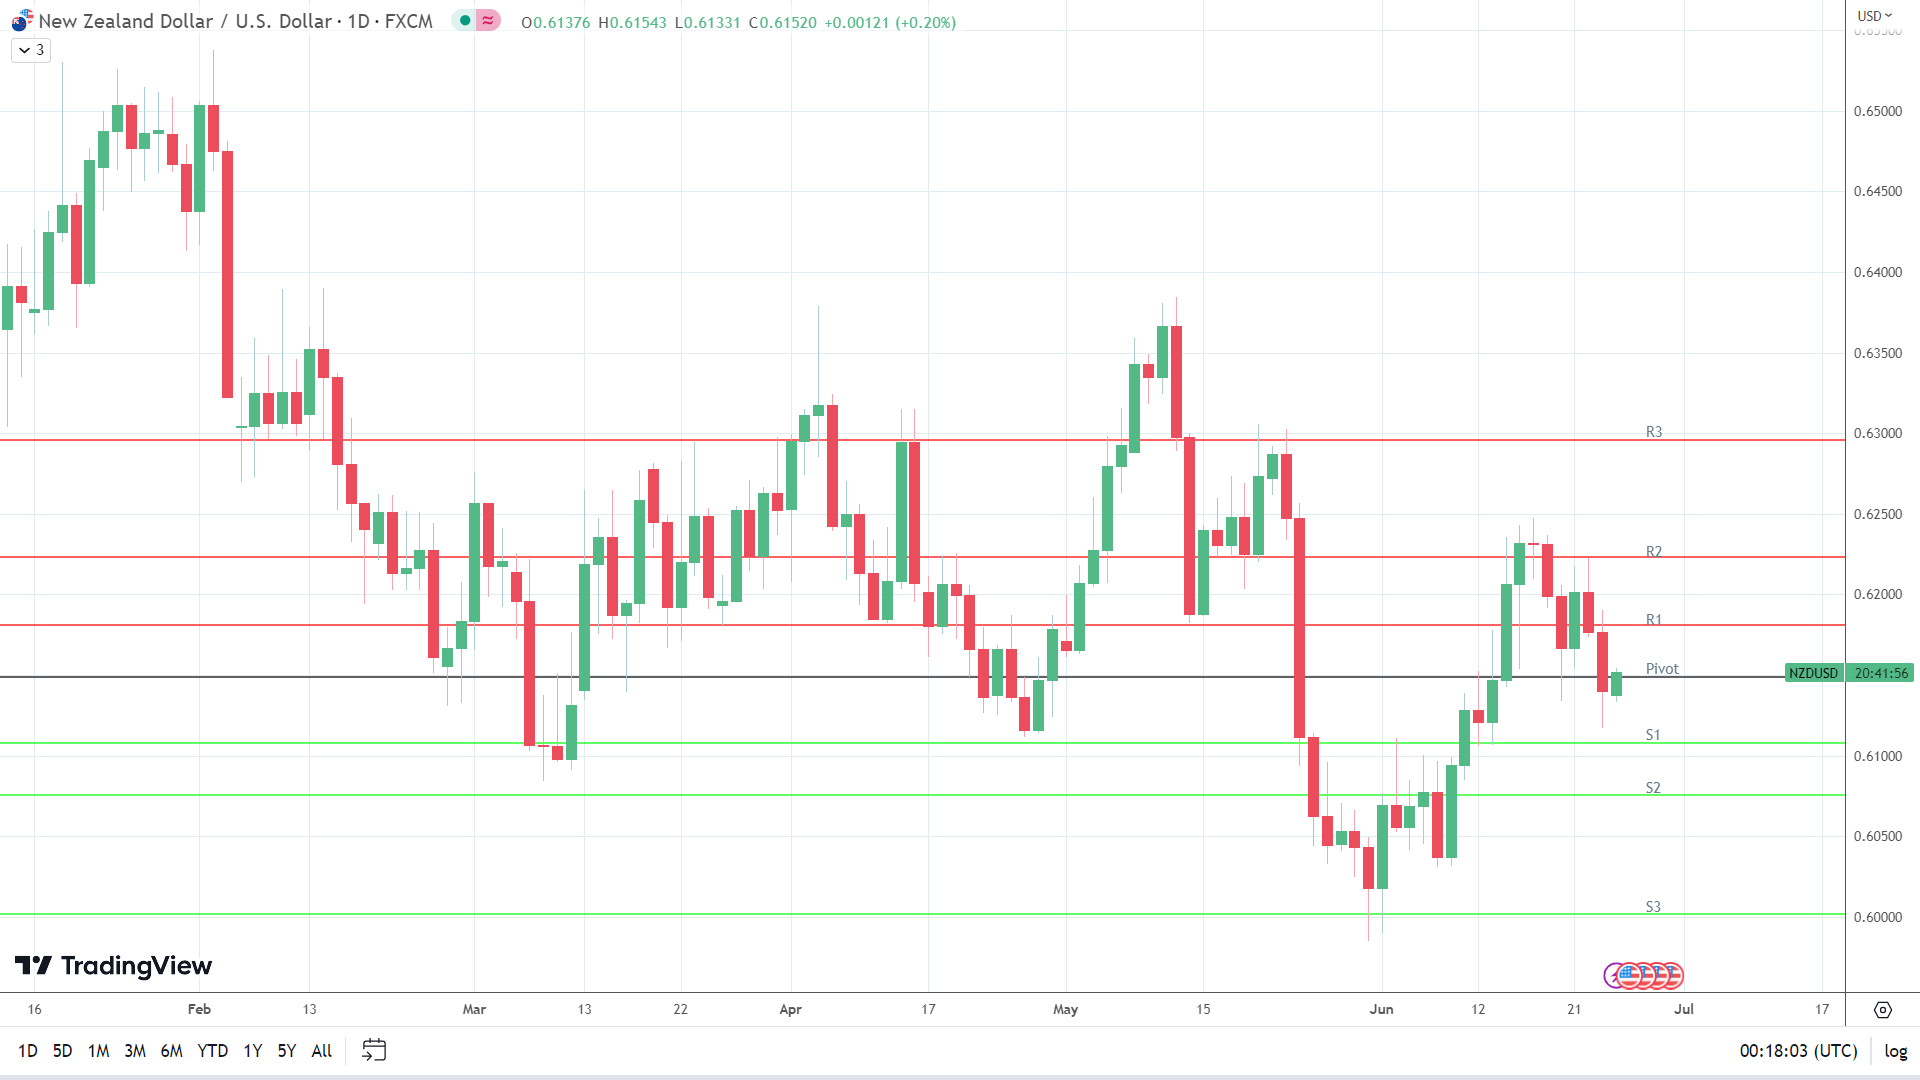
This morning, the NZD/USD was up 0.20% to $0.61520. A mixed start to the day saw the NZD/USD fall to an early low of $0.61331 before rising to a high of $0.61543.
Technical Indicators
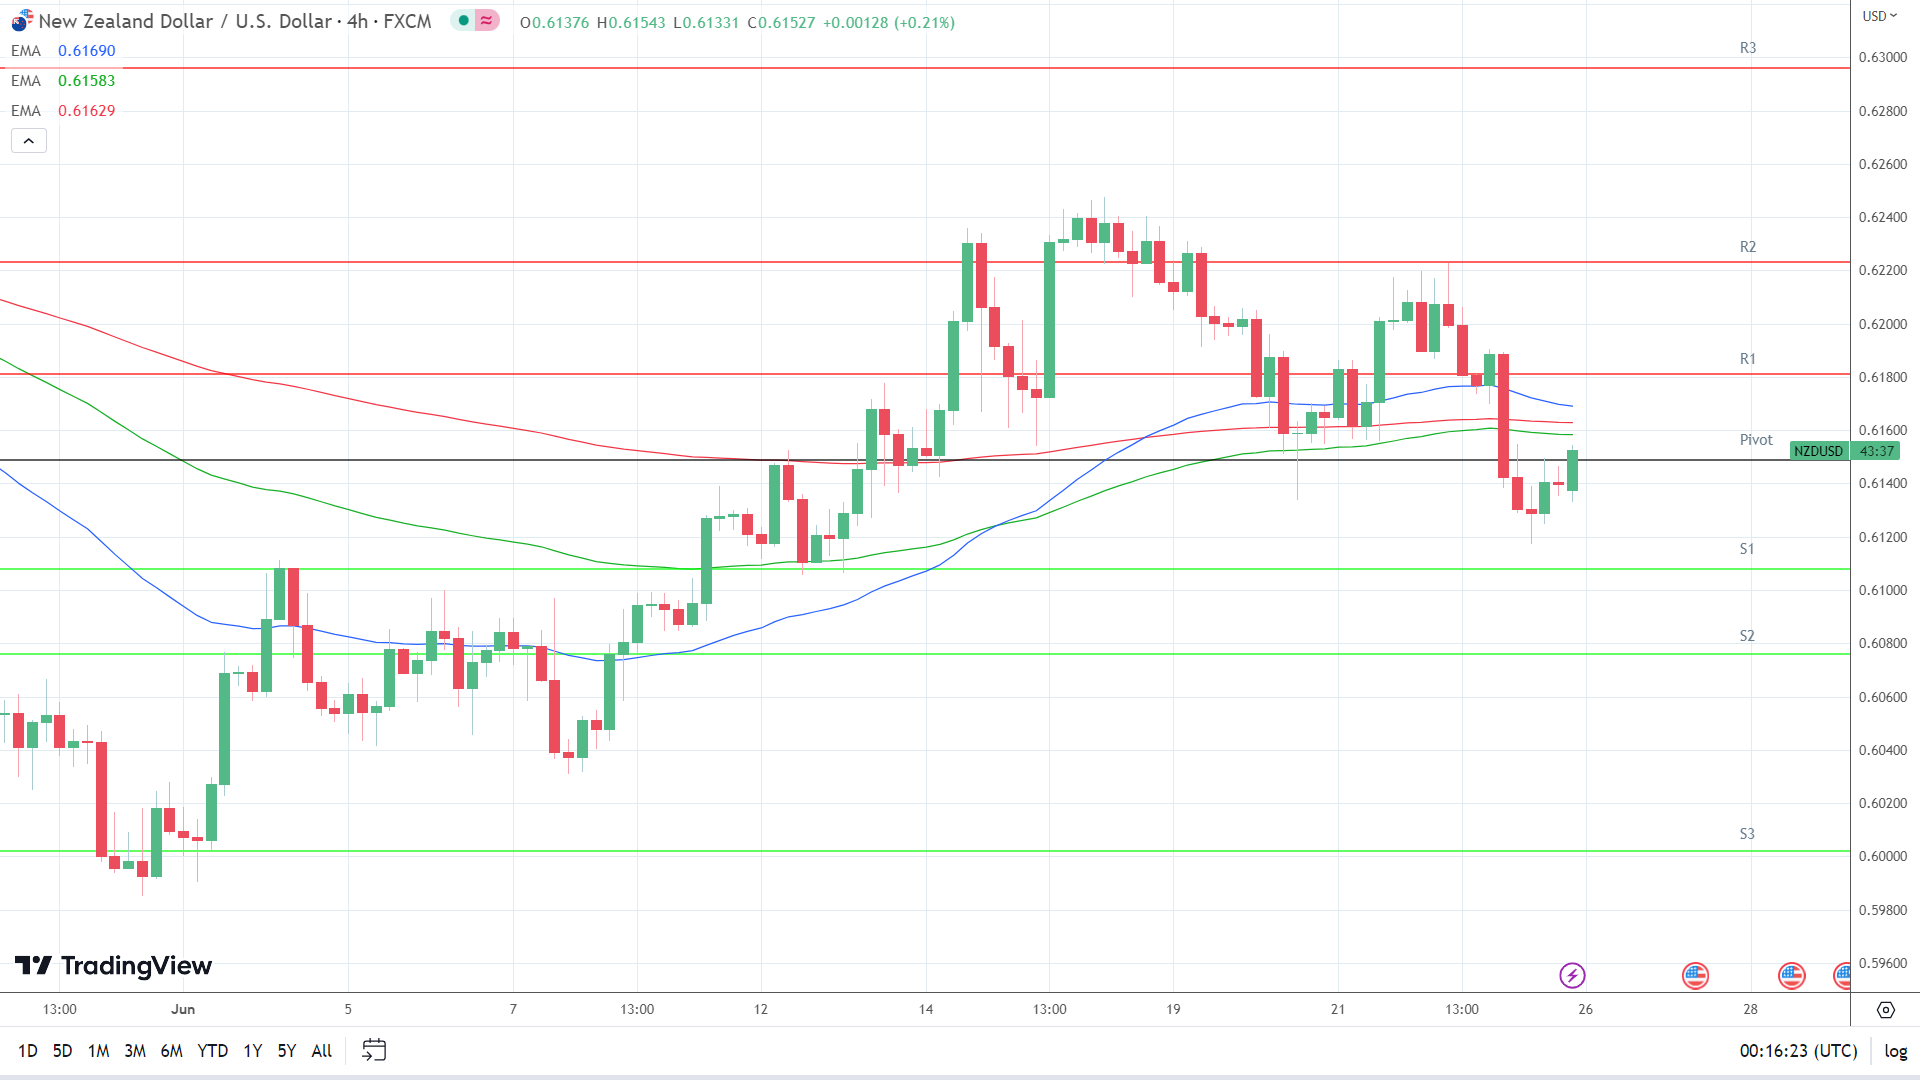
Looking at the EMAs and the 4-hourly chart, the EMAs sent bearish signals. The NZD/USD sat above the 100-day EMA, currently at $0.61583. The 50-day EMA closed in on the 200-day EMA, with the 100-day EMA easing back from the 200-day EMA, delivering bearish signals.
A move through the 100-day ($0.61583) and 200-day ($0.61629) EMAs would support a breakout from the 50-day EMA ($0.61690) to target R1 ($0.6181). However, failure to move through 50-day EMA ($0.61690) would leave S1 ($0.6108) in view. A move through the 50-day EMA would send a bullish signal.
Resistance & Support Levels
| R1 – $ | 0.6181 | S1 – $ | 0.6108 |
| R2 – $ | 0.6223 | S2 – $ | 0.6076 |
| R3 – $ | 0.6296 | S3 – $ | 0.6002 |
About the Author
Bob Masonauthor
With over 20 years of experience in the finance industry, Bob has been managing regional teams across Europe and Asia and focusing on analytics across both corporate and financial institutions. Currently he is covering developments relating to the financial markets, including currencies, commodities, alternative asset classes, and global equities.
Did you find this article useful?
Latest news and analysis


Advertisement