-
US-Euro Area Price Level and Inflation Differentials: I(0), I(1), Segmented Trends?

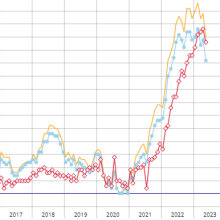
Do you calculate inflation differentials using … inflation or price levels? Follow up on this debate from a bit over a year ago. Here’s a time series plot of the log ratio of US CPI to Euro Area 19 HICP (seasonally adjusted by author using X13) (blue line, left scale), and month-on-month inflation differential annualized (tan line, right scale). chart Figure 1: Log ratio of US CPI-all urban to Euro Area 19 HICP (blue line, left scale), and month-on-month annualized inflation differential, in % (tan line, right scale). HICP seasonally adjusted using X13 log transform, X11 ARIMA seasonal adjustment. Inflation ... (full story)
- Comments
- Subscribe
-
- Older Stories
 From bnnbloomberg.ca|Jun 15, 2023
China’s home prices grew at the slowest pace in four months in May, underscoring the challenges the market is facing as economic growth loses momentum. New-home prices in 70 ...
 From fxstreet.com|Jun 15, 2023|1 comment
The USD/JPY pair catches aggressive bids during the Asian session on Thursday and touches the 141.00 mark for the first time since November 2022, confirming a breakout through a ...
 From meti.go.jp|Jun 15, 2023
tables charts
-
- Newer Stories
 From bfs.admin.ch|Jun 15, 2023
The Producer and Import Price Index fell in May 2023 by 0.3% compared with the previous month, reaching 109.1 points (December 2020 = 100). In particular, petroleum, natural gas ...
 From insee.fr|Jun 15, 2023
In May 2023, the Consumer Price Index (CPI) declined by 0.1% over one month, after +0.6% in April. The decrease in energy prices accentuated (‑3.0% after ‑0.7%) in the wake of ...
 From seco.admin.ch|Jun 15, 2023
The expert group on business cycles continues to expect significantly belowaverage growth for the Swiss economy, with a rate of 1.1% in 2023, followed by 1.5% in 2024 (GDP ...
- Story Stats
- Posted: Jun 15, 2023 2:20am
- Submitted by:Category: Fundamental AnalysisComments: 0 / Views: 806