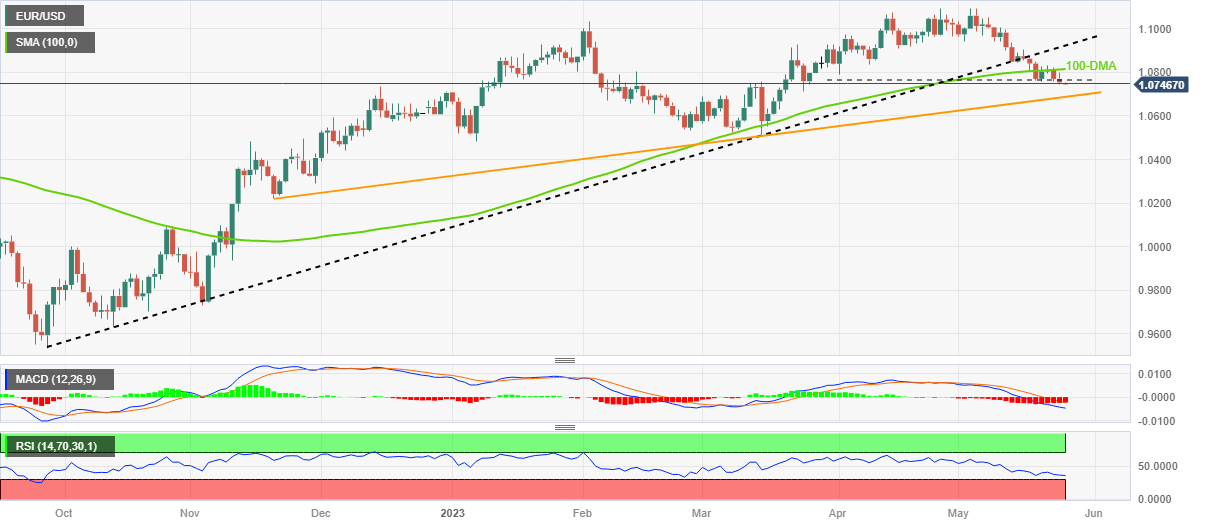
- EUR/USD drops to the lowest levels since late March, down for the third consecutive day.
- Clear reversal from 100-DMA hurdle, downside break of previous weekly bottom joins bearish MACD signals to favor Euro bears.
- Downbeat RSI conditions suggest limited room towards the south, highlighting six-month-old ascending support line.
EUR/USD holds lower grounds as bears prod the 1.0750 mark after falling to the fresh low since late March during early Thursday in Asia. In doing so, the Euro pair drops for the third consecutive day while slipping beneath the weekly low, as well as the two-month bottom marked the last week.
It should be noted that the Euro pair’s U-turn from the 100-DMA hurdle and bearish MACD signals add strength to the bearish bias. However, the RSI (14) line is nearly oversold and hence suggests limited downside room before the next leg of the south run.
As a result, the EUR/USD bears are well set to break the 1.0750 support and approach the 1.0700 round figure. However, an upward-sloping support line from late November 2022, close to 1.0690 by the pres time, gains the market’s attention.
In a case where the Euro pair breaks the aforementioned support line, the odds of witnessing a slump toward March’s low of 1.0515 and then toward the yearly low marked in January near 1.0480 can’t be ruled out.
On the other hand, a daily closing beyond the 100-DMA level of 1.0815 isn’t an open welcome for the EUR/USD bulls as the previous support line from September 2022, around 1.0920 at the latest, holds the key for the buyer’s entry.
Following that, the 1.1000 psychological magnet may act as an extra barrier for the Euro buyers targeting further upside of the pair.
EUR/USD: Daily chart
Trend: Limited downside expected
Information on these pages contains forward-looking statements that involve risks and uncertainties. Markets and instruments profiled on this page are for informational purposes only and should not in any way come across as a recommendation to buy or sell in these assets. You should do your own thorough research before making any investment decisions. FXStreet does not in any way guarantee that this information is free from mistakes, errors, or material misstatements. It also does not guarantee that this information is of a timely nature. Investing in Open Markets involves a great deal of risk, including the loss of all or a portion of your investment, as well as emotional distress. All risks, losses and costs associated with investing, including total loss of principal, are your responsibility. The views and opinions expressed in this article are those of the authors and do not necessarily reflect the official policy or position of FXStreet nor its advertisers. The author will not be held responsible for information that is found at the end of links posted on this page.
If not otherwise explicitly mentioned in the body of the article, at the time of writing, the author has no position in any stock mentioned in this article and no business relationship with any company mentioned. The author has not received compensation for writing this article, other than from FXStreet.
FXStreet and the author do not provide personalized recommendations. The author makes no representations as to the accuracy, completeness, or suitability of this information. FXStreet and the author will not be liable for any errors, omissions or any losses, injuries or damages arising from this information and its display or use. Errors and omissions excepted.
The author and FXStreet are not registered investment advisors and nothing in this article is intended to be investment advice.
Recommended content
Editors’ Picks
EUR/USD clings to gains above 1.0850 after US inflation data

EUR/USD trades in positive territory above 1.0850 in the American session on Friday. The US Dollar struggles to preserve its strength following the April PCE inflation data and helps the pair hold its ground heading into the weekend.
GBP/USD retreats from 1.2765, holds on to modest gains

GBP/USD posted a two-day high peat at 1.2765 in the American session, as US data showed that the core PCE inflation held steady at 2.8% on a yearly basis in April. The pair retreated afterwards as risk aversion triggered US Dollar demand.
Gold falls towards $2,330 as the mood sours

US inflation-related data took its toll on financial markets. Wall Street turned south after the opening and without signs of easing price pressures in the world’s largest economy. The US Dollar takes the lead in a risk-averse environment.
Here’s why Chainlink price could crash 15% despite spike in social volume Premium

Chainlink price has flashed multiple sell signals after its recent climb, hinting at a short-term correction. This signal comes despite a double-digit growth in its social volume. LINK bulls need to exercise caution as this forecast is backed by on-chain metrics.
Week ahead – ECB rate cut might get eclipsed by BoC surprise and NFP report

ECB set to slash rates on Thursday, focus on forward guidance. But will the BoC take the lead when it meets on Wednesday? US jobs report eyed on Friday as Fed unyielding on cuts. OPEC+ might extend some output reductions into 2025.