
Advertisement
Advertisement
USD/JPY Bulls to Target 138.5 on Debt Ceiling Progress
By:
It is a busy day for the USD/JPY. Japan trade data will influence ahead of the US session. US stats, Fed chatter, and the debt ceiling will influence later.

In this article:
It is a relatively busy start to the day for the USD/JPY. Japanese trade figures for April will draw interest. Following the better-than-expected Q1 GDP numbers on Wednesday, better-than-expected trade data would fuel bets on a shift in the Bank of Japan’s ultra-loose policy.
Economists forecast the trade deficit to narrow from ¥755.1 billion to ¥613.8 billion. However, the devil will be in the details. A larger-than-expected fall in imports would raise demand concerns. Economists forecast imports to fall by 0.3% and exports to rise by 3.0%.
Beyond the economic calendar, we expect further market reaction to US debt ceiling talks.
USD/JPY Price Action
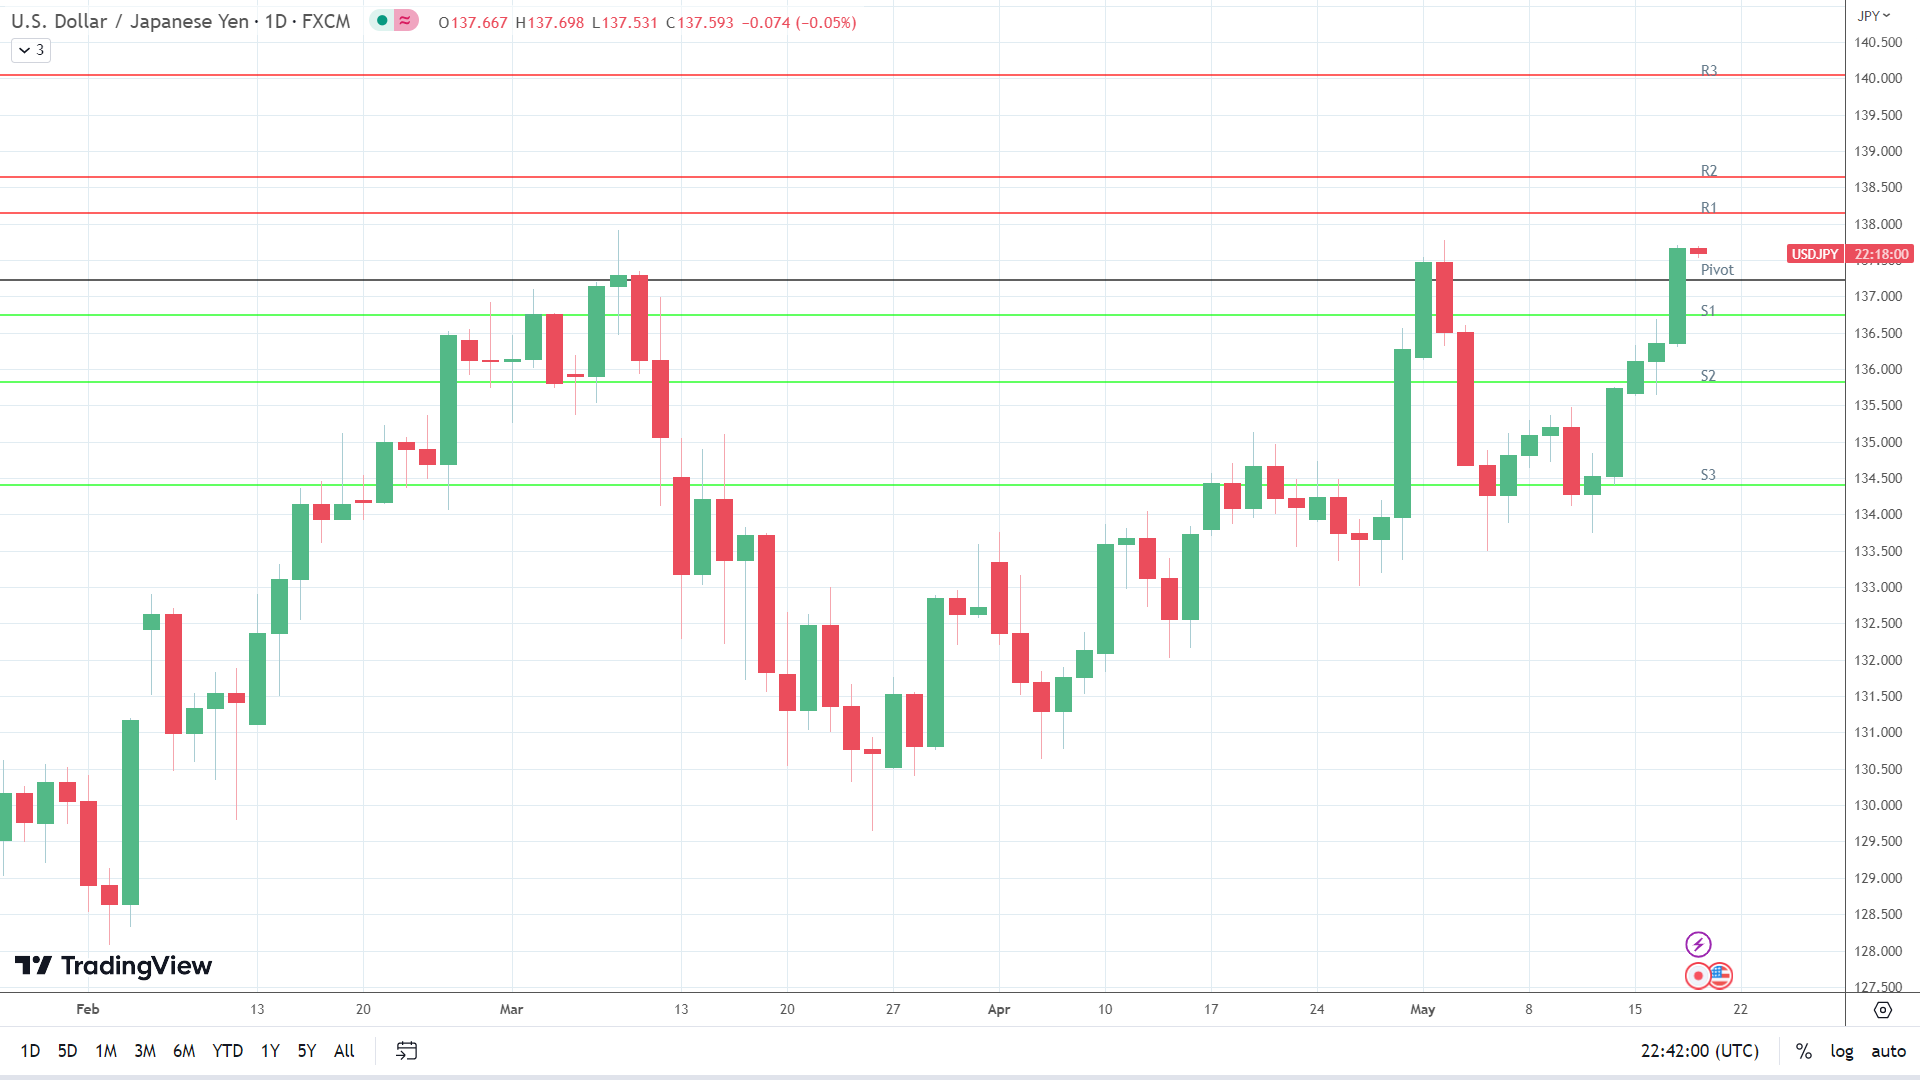
This morning, the USD/JPY was down 0.05% to 137.593. A range-bound start to the day saw the USD/JPY fall to an early low of 137.531 before rising to a high of 137.698.
Technical Indicators
Resistance & Support Levels
| R1 – ¥ | 138.1517 | S1 – ¥ | 136.7427 |
| R2 – ¥ | 138.6363 | S2 – ¥ | 135.8183 |
| R3 – ¥ | 140.0453 | S3 – ¥ | 134.4093 |
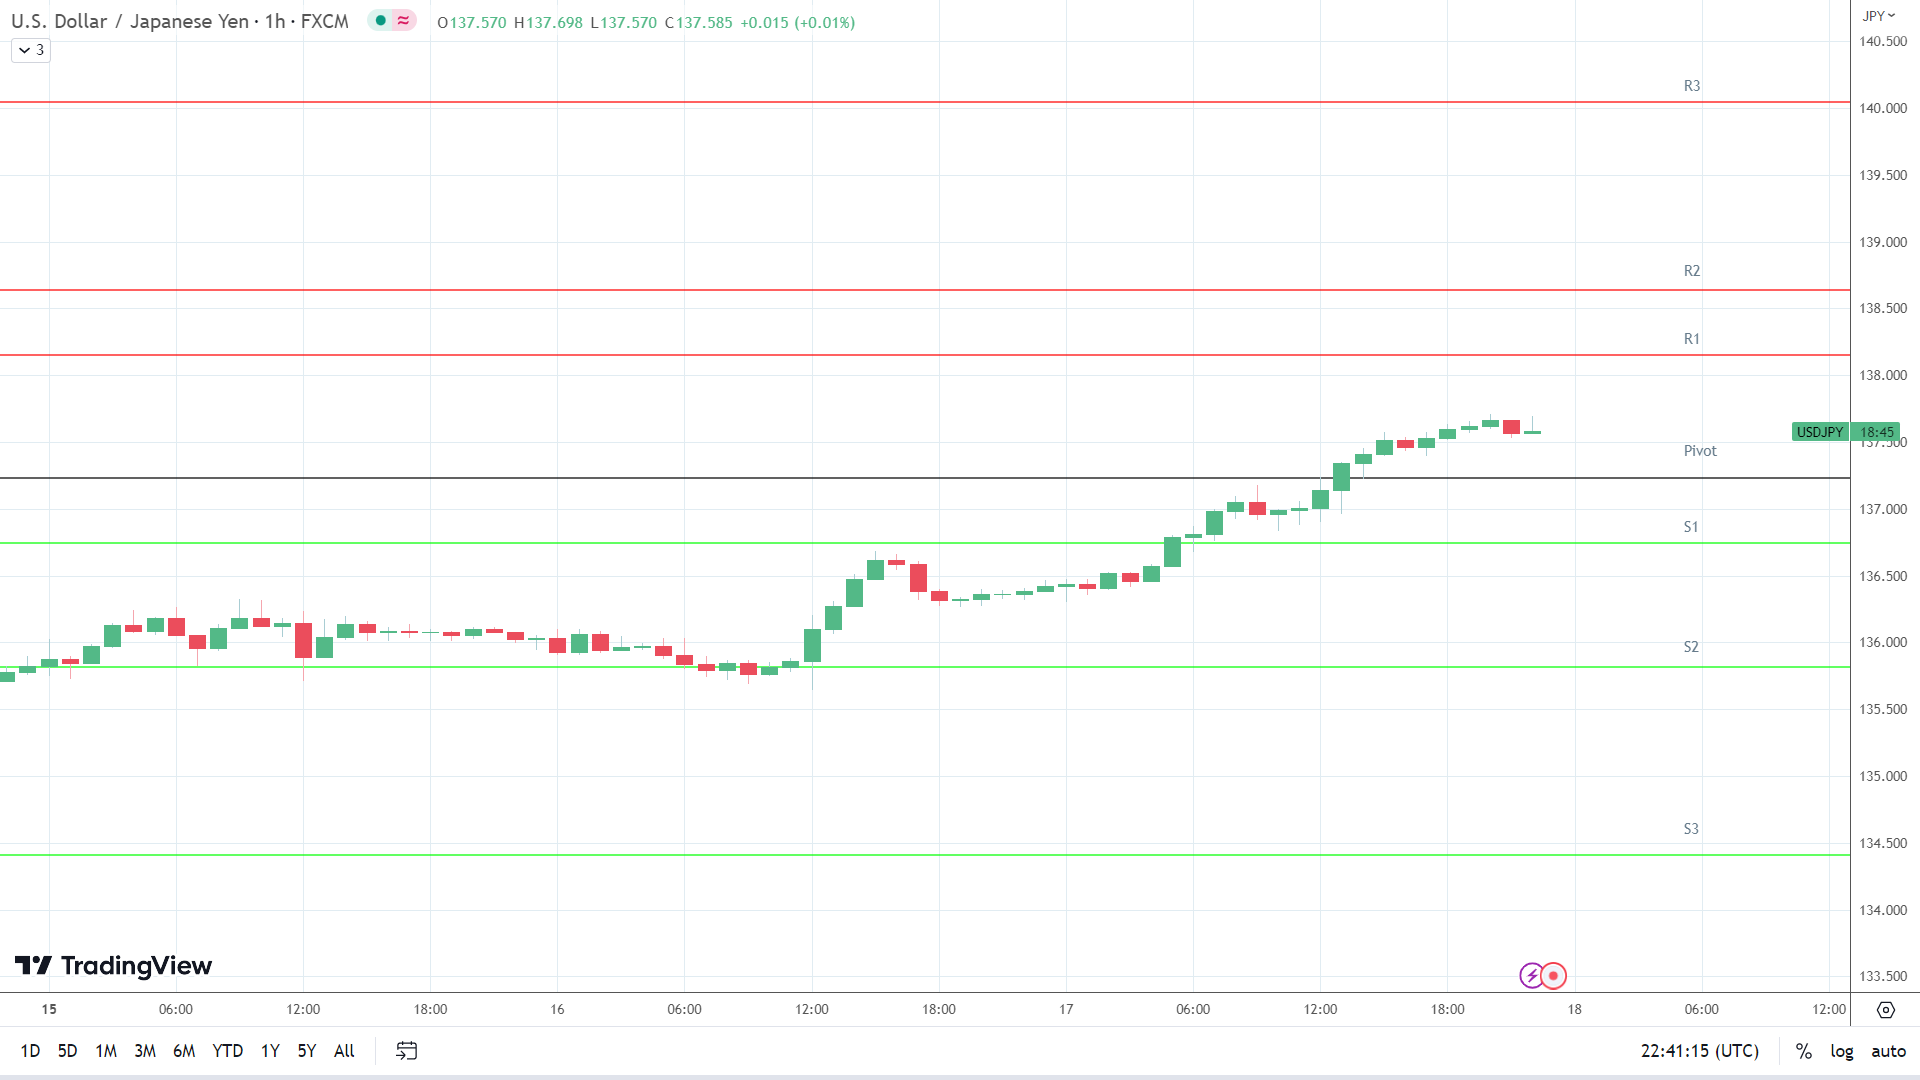
The USD/JPY needs to avoid the 137.227 pivot to target the First Major Resistance Level (R1) at 138.152. A move through the Wednesday high of 137.712 would signal a bullish USD/JPY session. However, the market risk sentiment must support a USD/JPY breakout.
In case of an extended rally, the bulls would likely test the Second Major Resistance Level (R2) at 138.636. The Third Major Resistance Level (R3) sits at 140.053.
A fall through the pivot would bring the First Major Support Level (S1) at 136.743 into play. However, barring a risk-off fueled sell-off, the USD/JPY pair should avoid sub-136 and the Second Major Support Level (S2) at 135.818. The Third Major Support Level (S3) sits at 134.409.
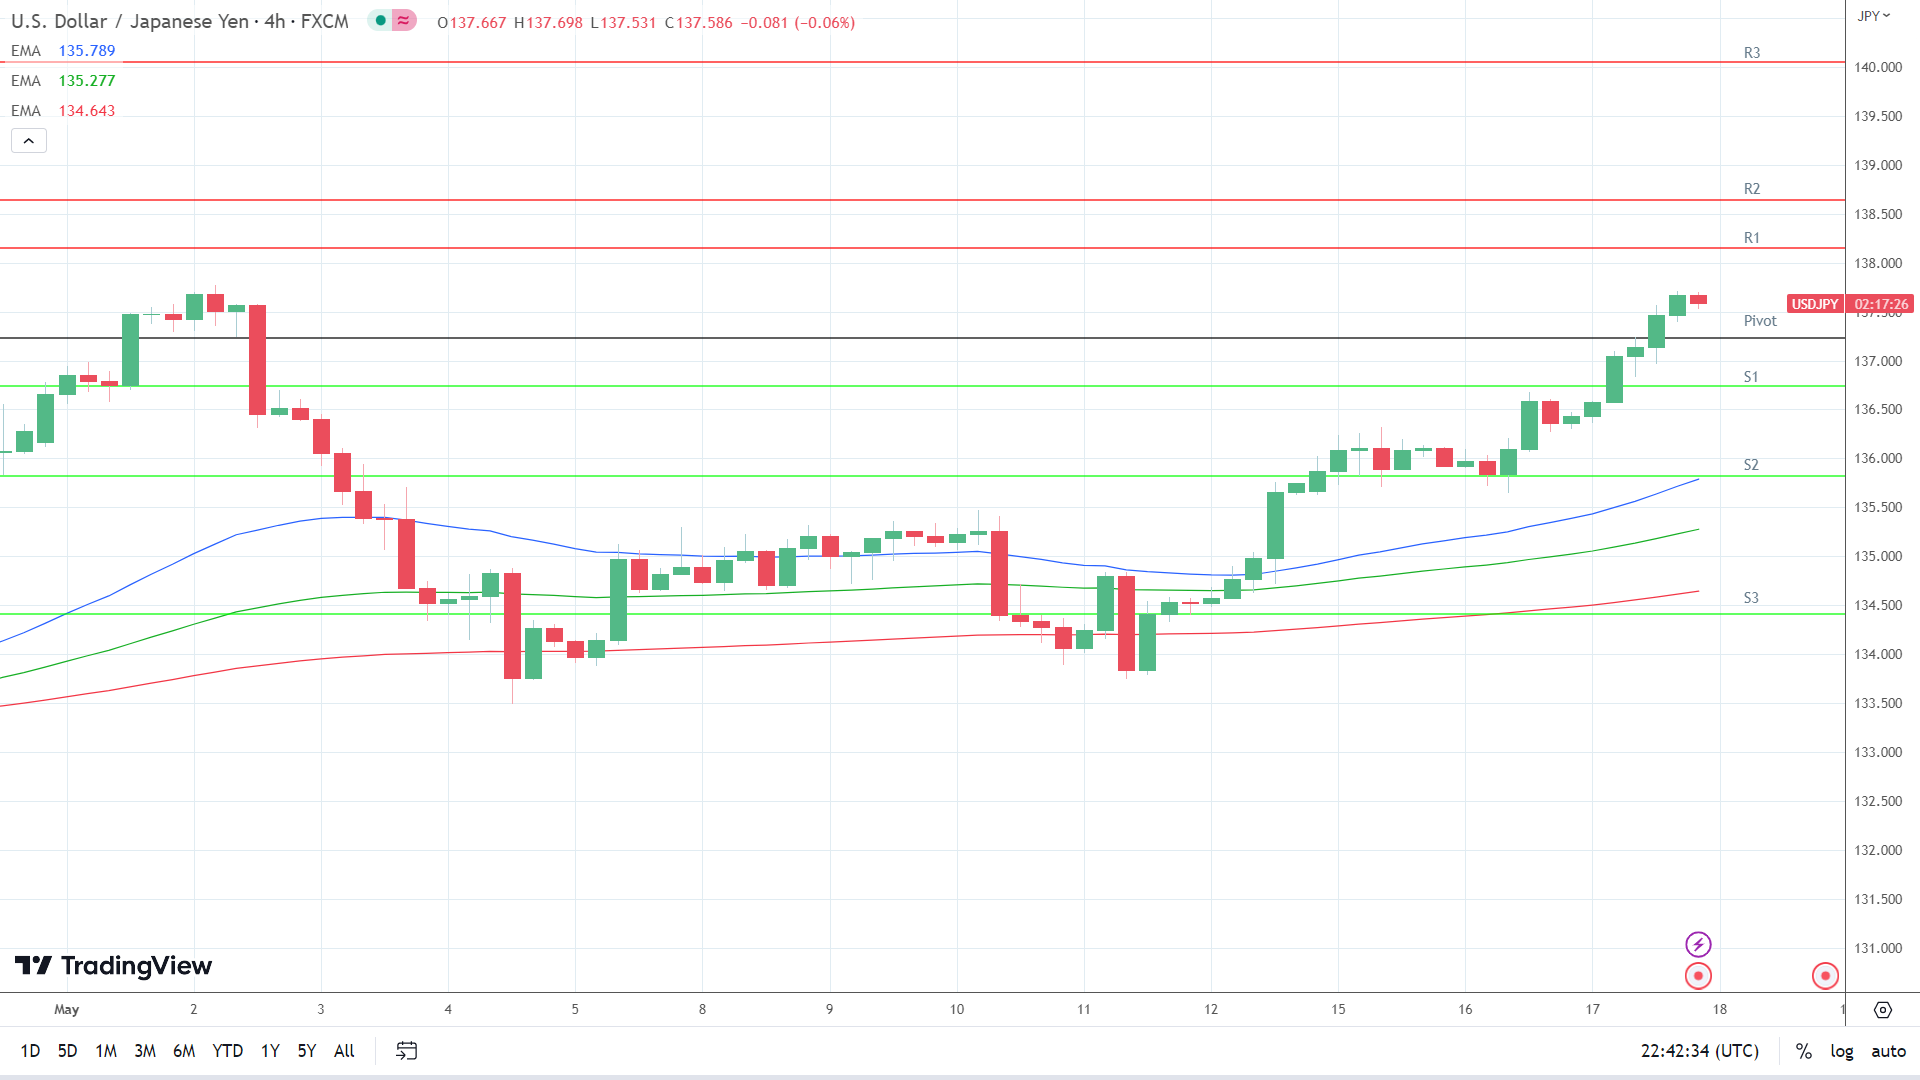
Looking at the EMAs and the 4-hourly chart, the EMAs send bullish signals. The USD/JPY sits above the 50-day EMA (135.789). The 50-day pulled further away from the 100-day EMA, with the 100-day EMA widening from the 200-day EMA, delivering bullish signals.
A USD/JPY hold above the Major Support Levels and 50-day EMA (135.789) would support a breakout from R1 (138.152) to target R2 (138.636). However, a fall through the S1 (136.743) would bring S2 (135.818) and the 50-day EMA (135.789) into view. A USD/JPY fall through the 50-day EMA would send a bearish signal.
The US Session
Looking ahead to the US session, it is a relatively busy day on the US economic calendar. US jobless claims and the Philly Fed Manufacturing Index and sub-components will draw interest.
An unexpected slide in the Philly Fed Manufacturing Index would fuel recessionary fears. However, investors should consider the Philly Fed Prices, New Orders, and Employment sub-components.
While the economic calendar is busier, the markets should monitor FOMC commentary. Fed members Jefferson, Barr, and Logan will speak today.
Beyond the economic calendar, US debt ceiling-related news will continue to influence. Optimism toward a debt ceiling deal supported a USD/JPY breakout on Wednesday.
About the Author
Bob Masonauthor
With over 20 years of experience in the finance industry, Bob has been managing regional teams across Europe and Asia and focusing on analytics across both corporate and financial institutions. Currently he is covering developments relating to the financial markets, including currencies, commodities, alternative asset classes, and global equities.
Did you find this article useful?
Latest news and analysis


Advertisement