
Advertisement
Advertisement
AUD/USD and NZD/USD Fundamental Analysis: Wage Growth in Focus
By:
It is a relatively quiet day for the AUD/USD. However, Aussie wage growth numbers will move the dial as US debt ceiling talks continue.

In this article:
It is a relatively busy Wednesday for the AUD/USD and NZD/USD. Following the RBA-induced slump in consumer confidence, the market focus will turn to Australian wage growth.
Wage growth is a focal point for the RBA, which remains committed to bringing inflation to target. A pickup in wage growth would offset the effect of higher interest rates on disposable income and demand.
Economists forecast wages to increase by 0.9% in Q1 versus 0.8% in Q4. Year-over-year, economists expect wages to rise by 3.6% versus 3.3% in Q4. Hotter-than-expected wage growth numbers would pressure the RBA to maintain a hawkish policy outlook.
According to the RBA meeting minutes, Board members see wage growth stabilizing. Contrary numbers could ignite bets on another interest rate hike before hitting the pause button.
From China, house price numbers for April will also draw interest. An improving housing market would be a bullish macroeconomic indicator.
Later today, US debt ceiling-related news and Fed commentary will need consideration.
AUD/USD Price Action
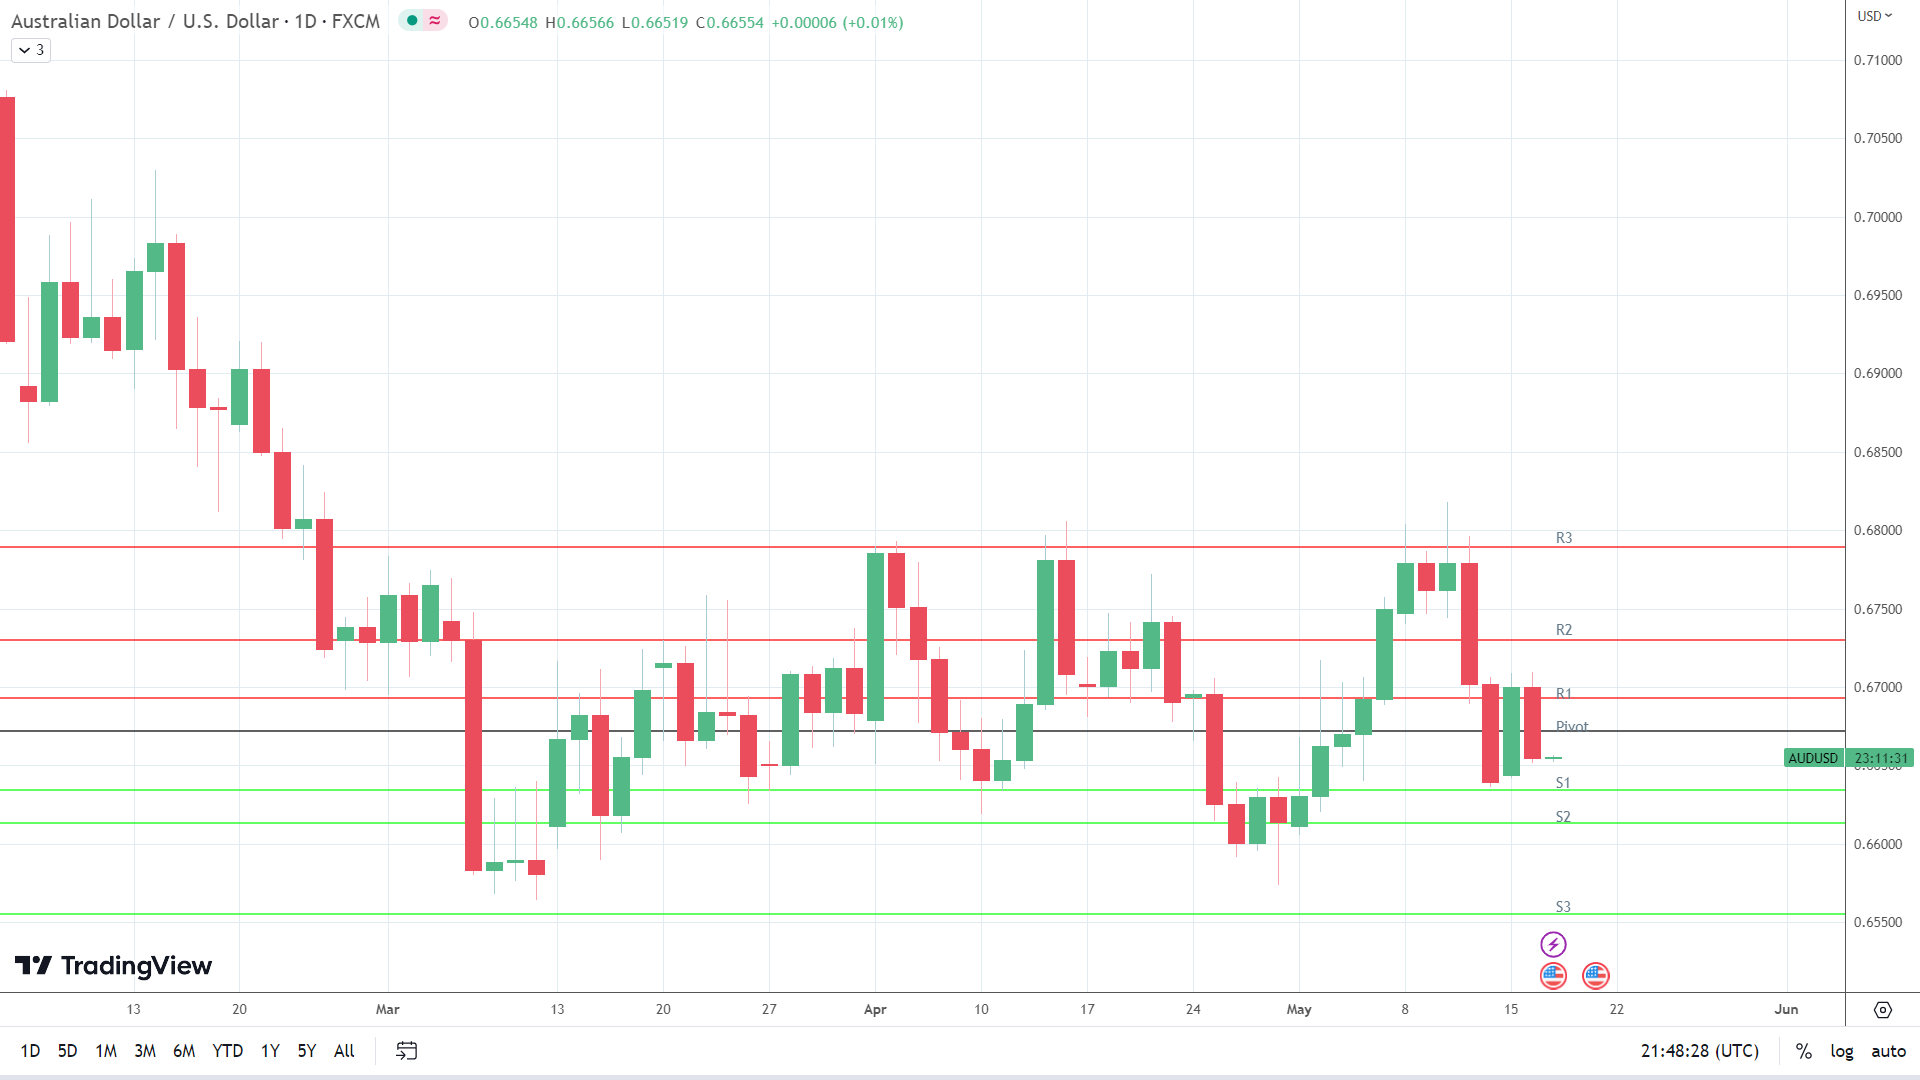
This morning, the AUD/USD was up 0.01% to $0.66554. A choppy start to the day saw the AUD/USD fall to an early low of $0.66519 before rising to a high of $0.66566.
Technical Indicators
Resistance & Support Levels
| R1 – $ | 0.6693 | S1 – $ | 0.6634 |
| R2 – $ | 0.6730 | S2 – $ | 0.6613 |
| R3 – $ | 0.6789 | S3 – $ | 0.6555 |
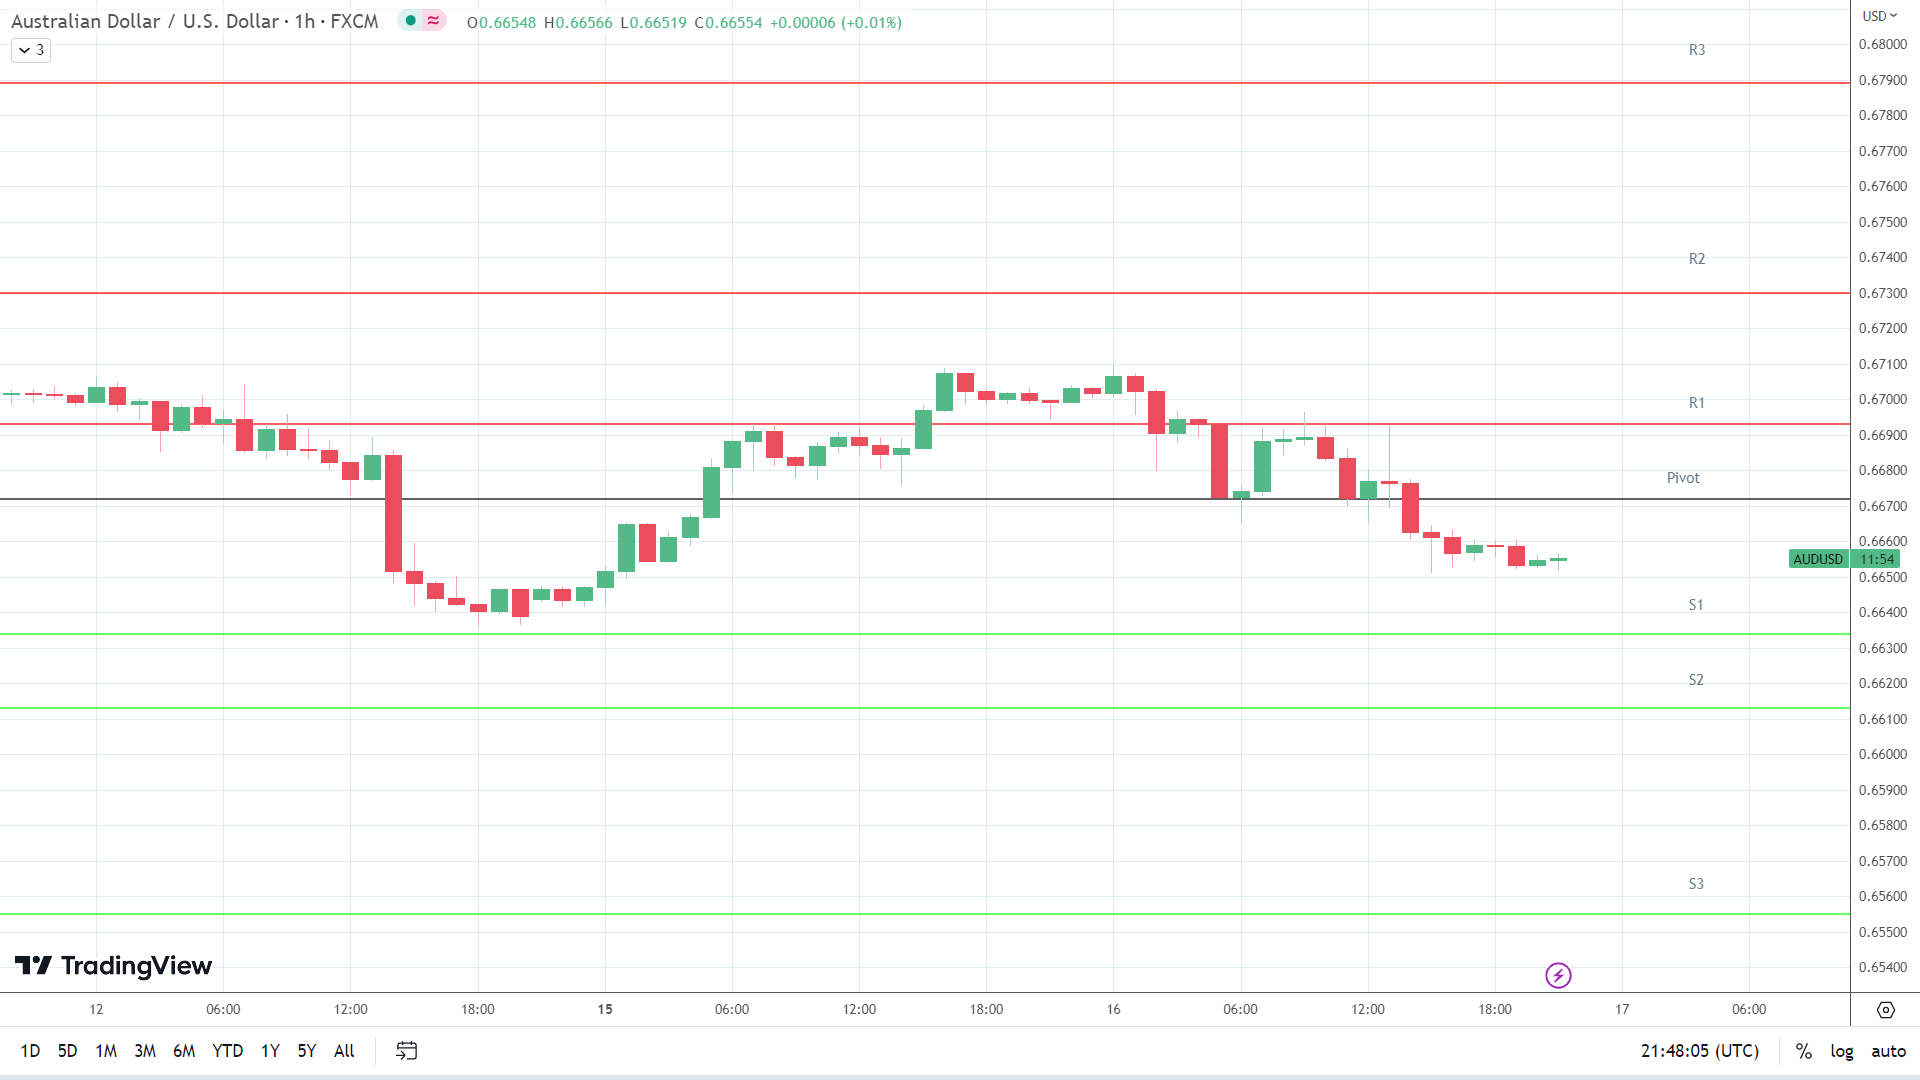
The AUD/USD needs to move through the $0.6672 pivot to target the First Major Resistance Level (R1) at $0.6693 A return to $0.6675 would signal a bullish session. However, the Aussie would need debt ceiling news to support a breakout.
In case of a breakout session, the Aussie would likely test the Second Major Resistance Level (R2) at $0.6730. The Third Major Resistance Level (R3) sits at $0.6789.
Failure to move through the pivot would leave the First Major Support Level (S1) at $0.6634 in play. However, barring a risk-off-fueled sell-off, the AUD/USD pair should avoid sub $0.66. The Second Major Support Level (S2) at $0.6613 should limit the downside.
The Third Major Support Level (S3) sits at $0.6555.
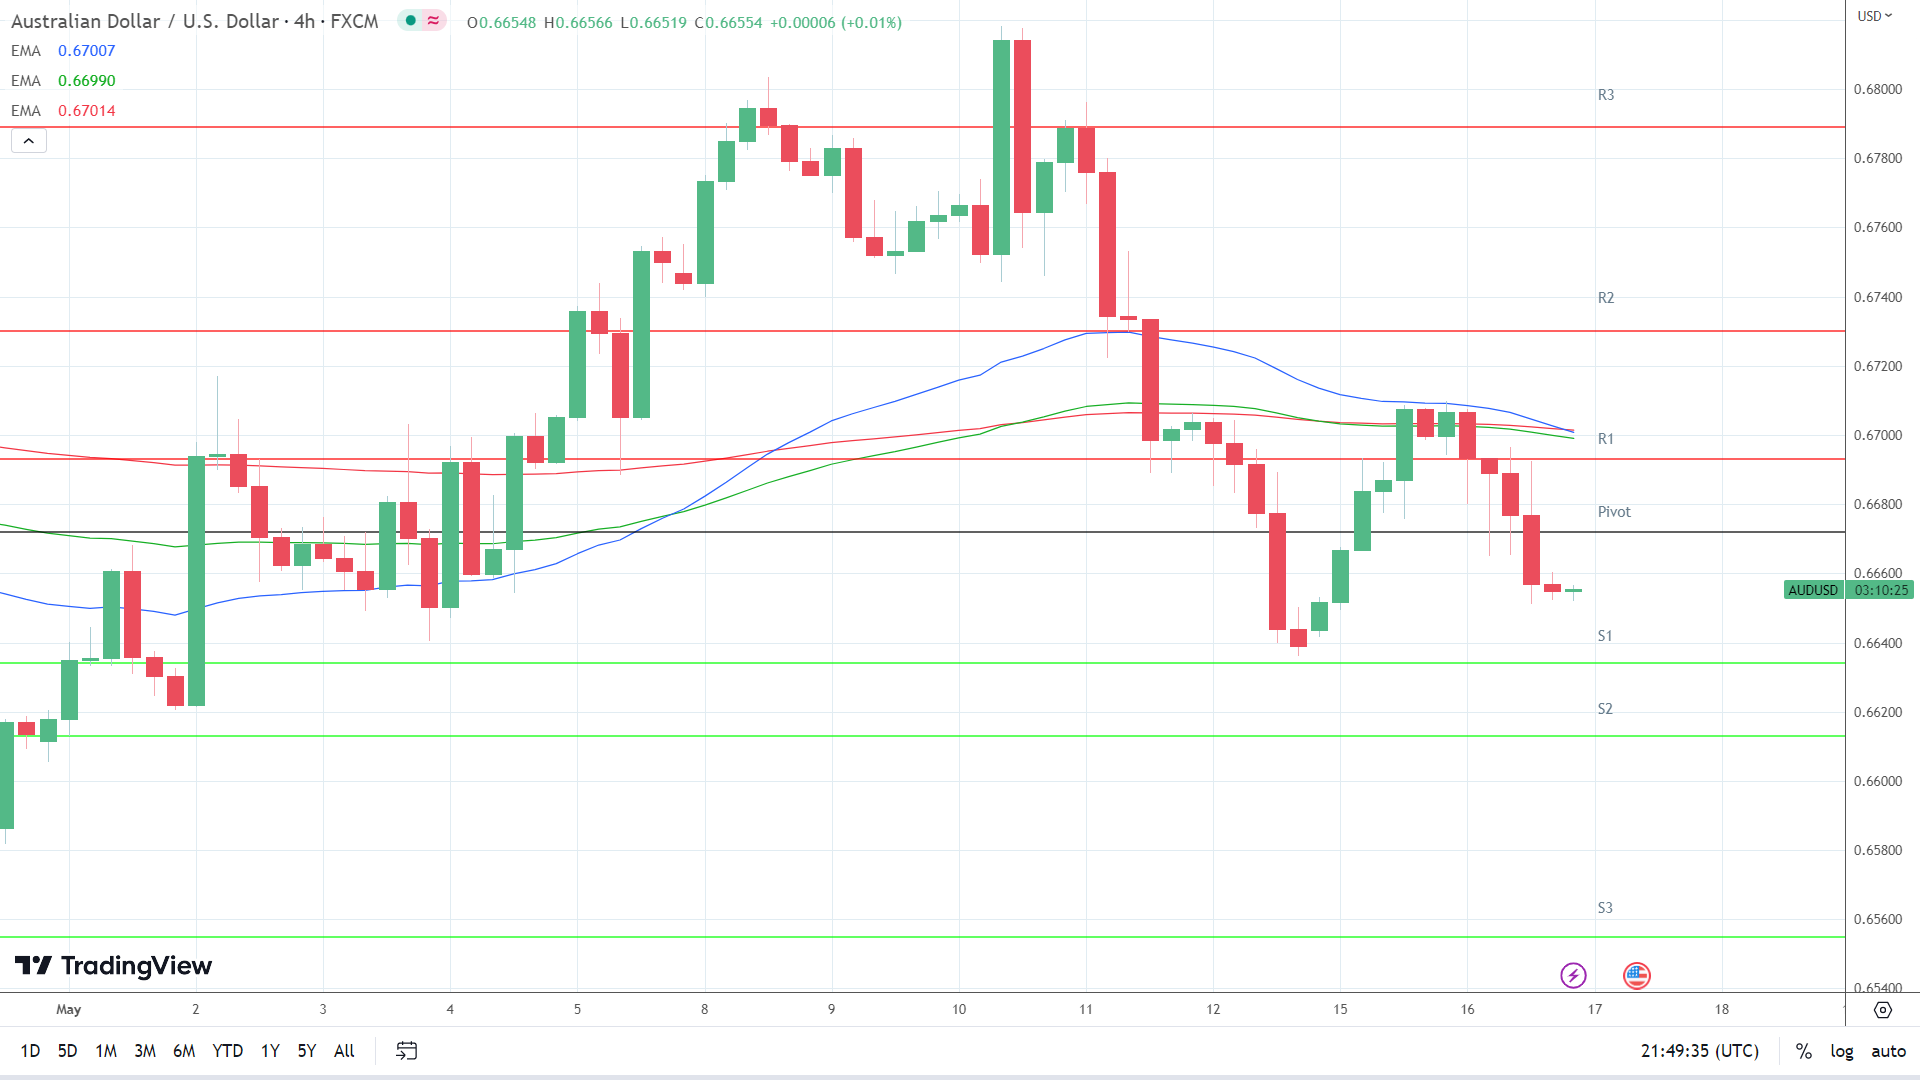
Looking at the EMAs and the 4-hourly chart, the EMAs sent bearish signals. The AUD/USD sits below the 200-day EMA, currently at $0.67014. The 50-day EMA crossed through the 100-day EMA, with the 100-day EMA pulling back from the 200-day EMA, delivering bearish signals.
An AUD/USD move through R1 ($0.6693) would support a breakout from the EMAs to target R2 ($0.6730). However, failure to move through the 200-day EMA ($0.67014) would leave S1 ($0.6634) in view. An AUD/USD move through the 50-day EMA (0.67007) would send a bullish signal.
NZD/USD Price Action
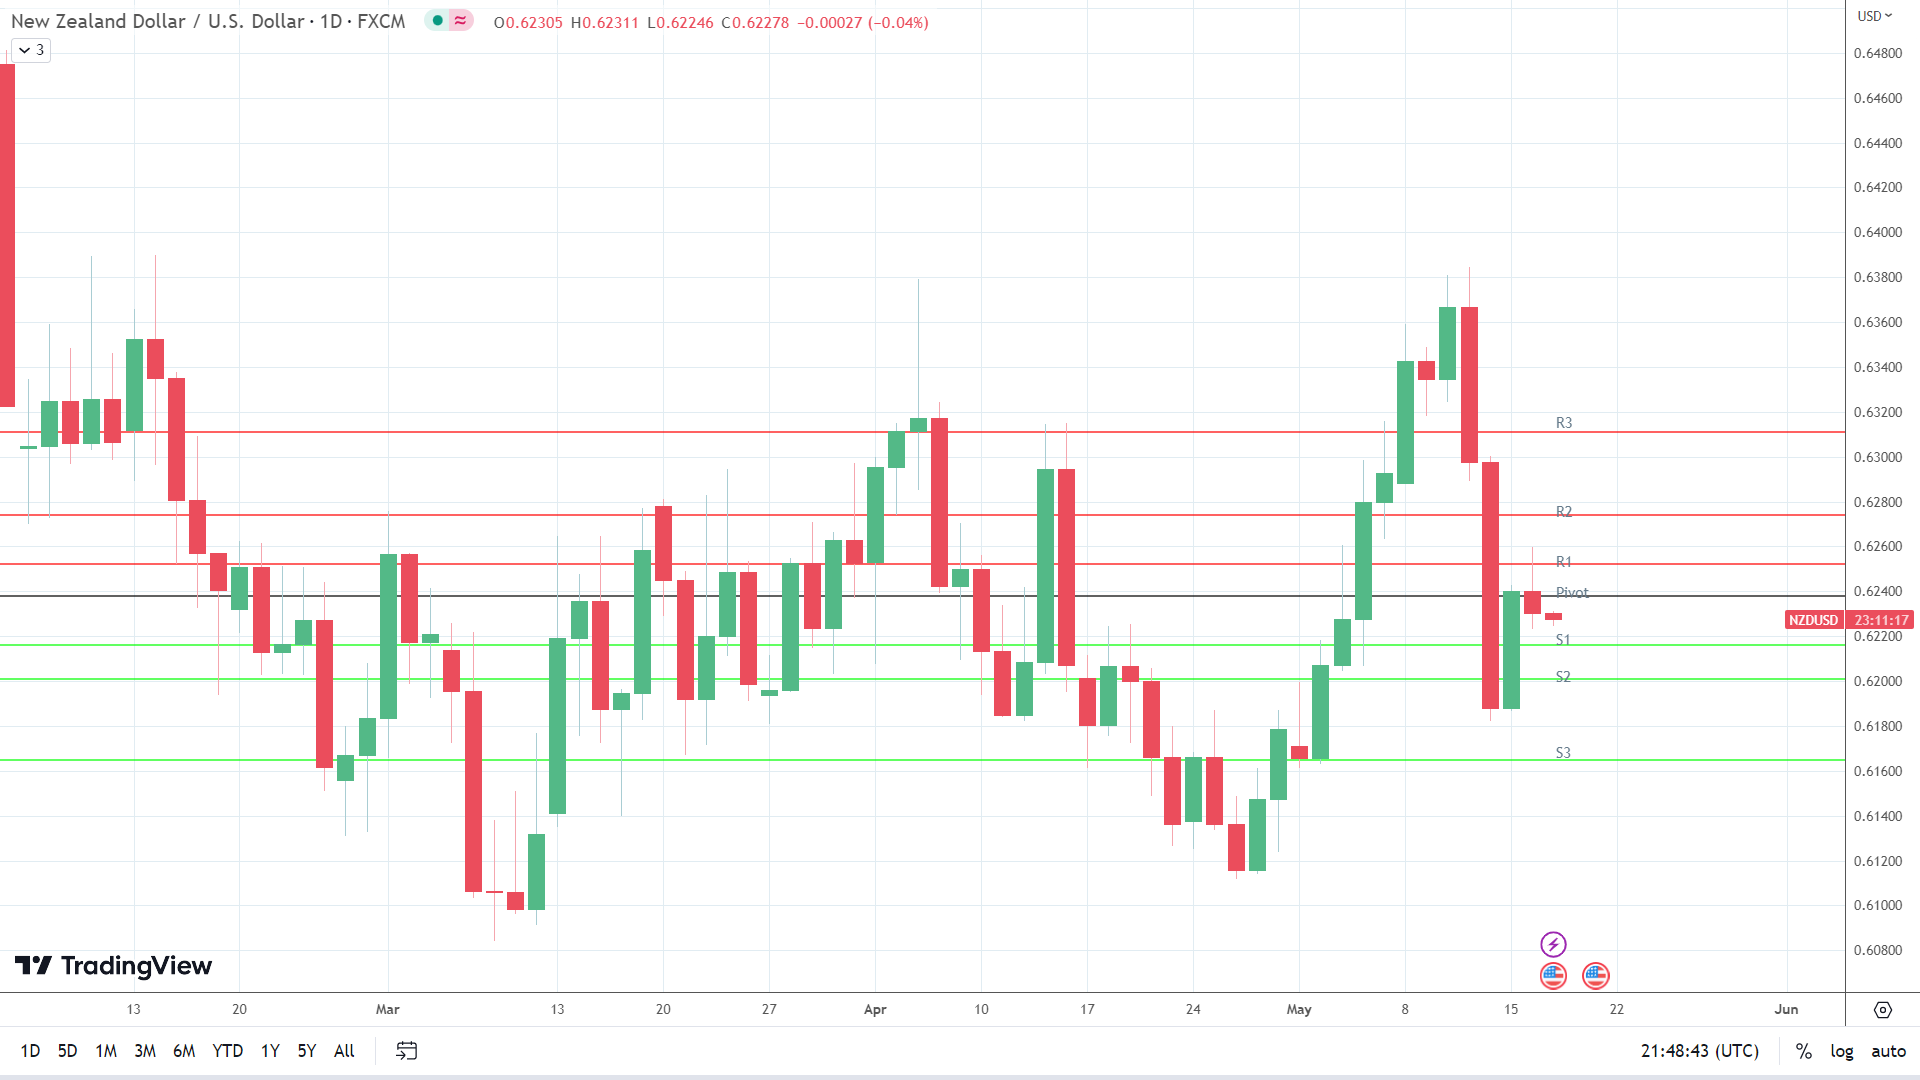
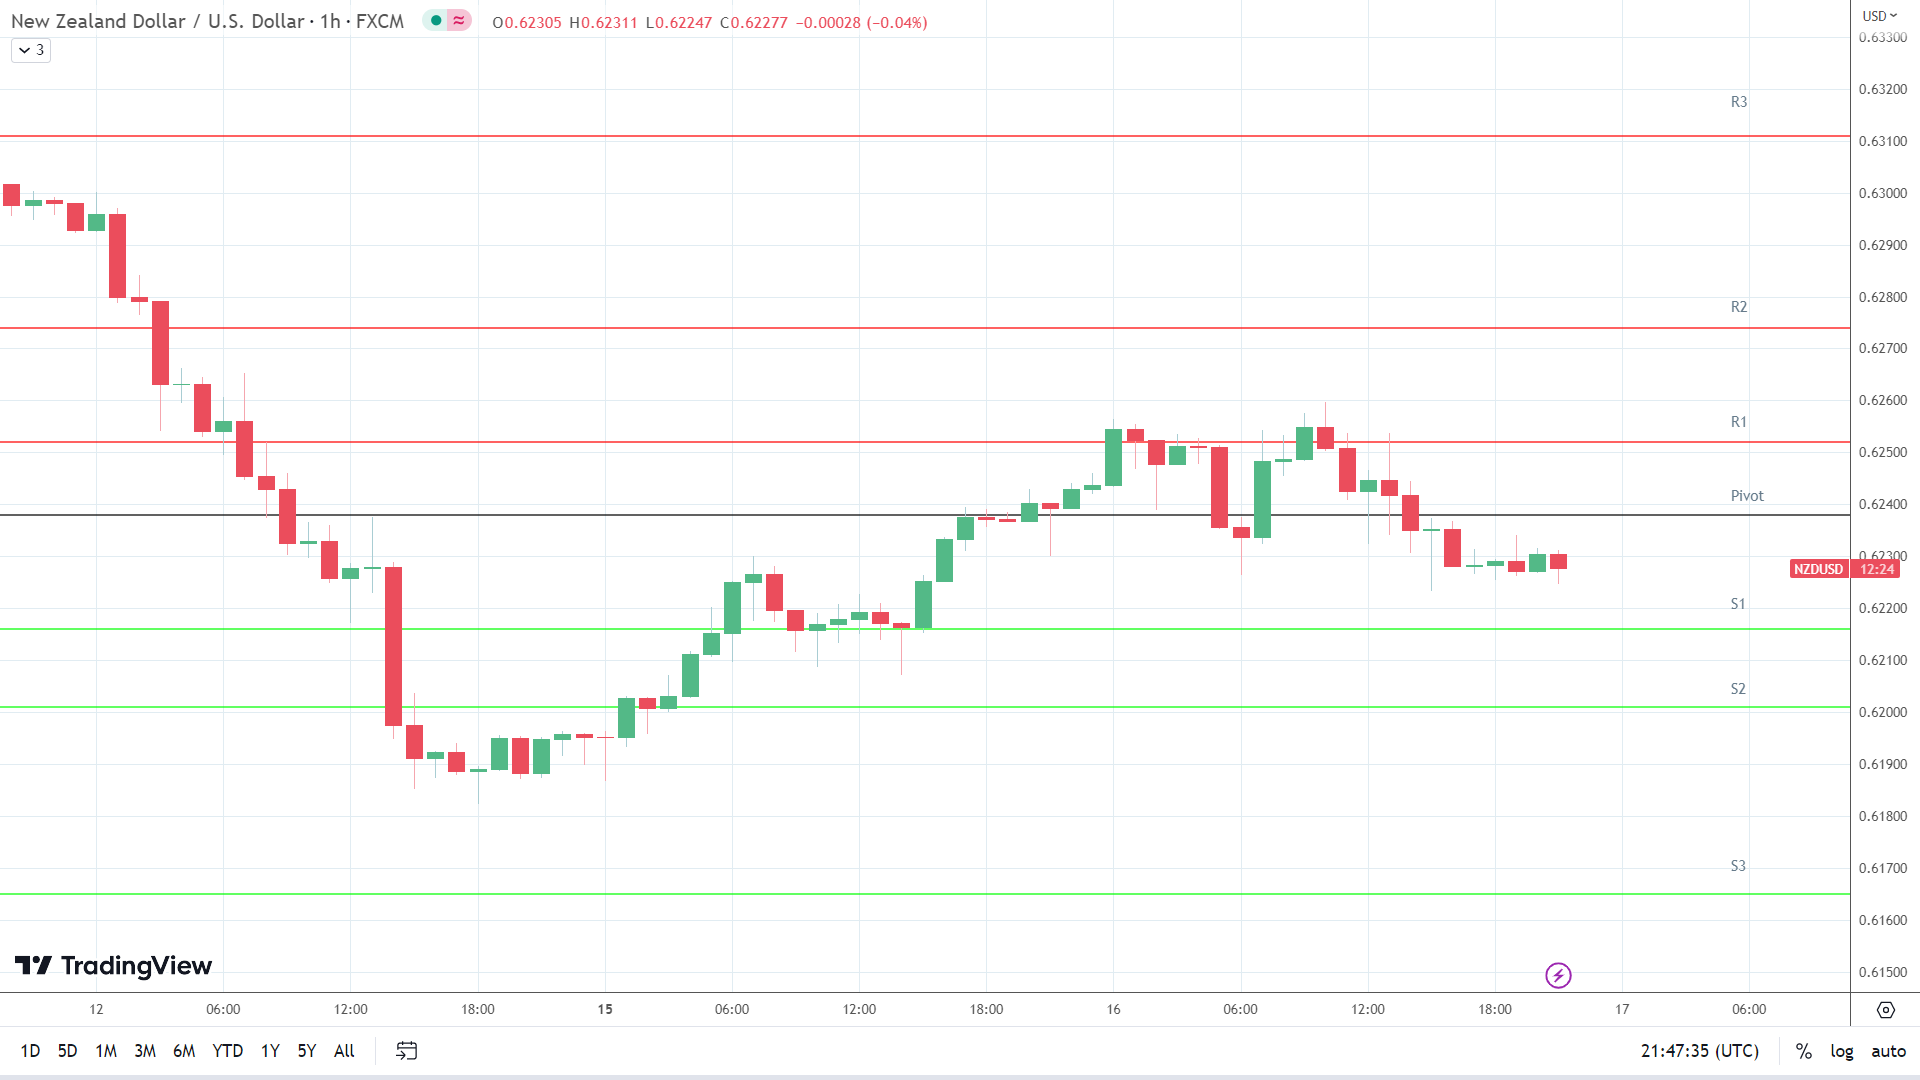
This morning, the NZD/USD was down 0.04% to $0.62278. A mixed start to the day saw the NZD/USD rise to an early high of $0.62311 before falling to a low of $0.62246.
Technical Indicators
Resistance & Support Levels
| R1 – $ | 0.6252 | S1 – $ | 0.6216 |
| R2 – $ | 0.6274 | S2 – $ | 0.6201 |
| R3 – $ | 0.6311 | S3 – $ | 0.6165 |
The NZD/USD has to move through the $0.6238 pivot to target the First Major Resistance Level (R1) at $0.6252 and the Tuesday high of $0.62597. A return to $0.6250 would signal a bullish session. However, US debt ceiling news and economic data from China must support a session breakout.
In the case of a breakout session, the Kiwi would likely test the Second Major Resistance Level (R2) at $0.6274 and resistance at $0.63. The Third Major Resistance Level (R3) sits at $0.6311.
Failure to move through the pivot would leave the First Major Support Level (S1) at $0.6216 in play. However, barring a risk-off-fueled sell-off, the NZD/USD should steer clear of sub-$0.62. The Second Major Support Level (S2) at $0.6201 should limit the downside.
The Third Major Support Level (S3) sits at $0.6165.
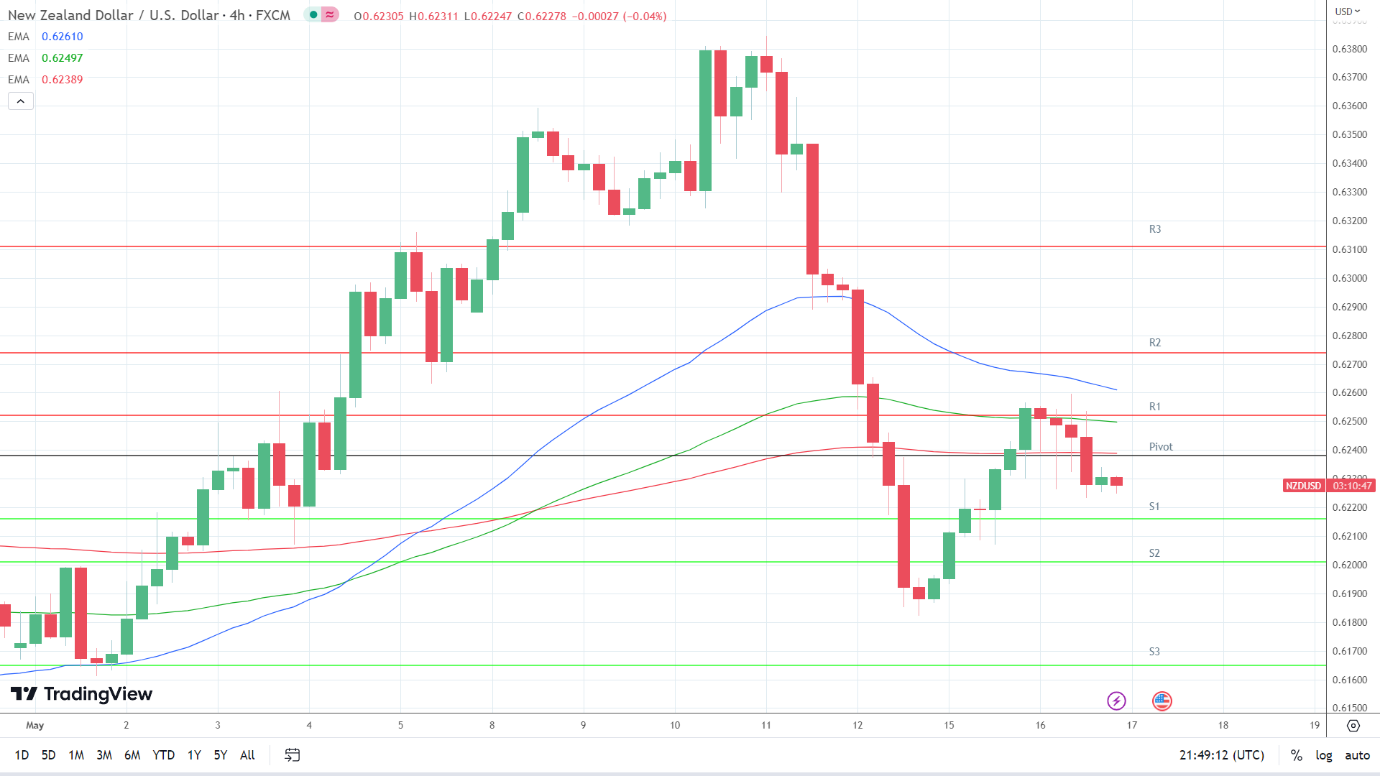
Looking at the EMAs and the 4-hourly chart, the EMAs sent bearish signals. The NZD/USD sits below the 200-day EMA, currently at $0.62389. The 50-day EMA closed in on the 100-day EMA, with the 100-day EMA narrowing to the 200-day EMA, delivering bearish signals.
A move through the 200-day EMA ($0.62389) would support a breakout from the 100-day EMA ($0.62497) and R1 ($0.6252) to target the 50-day EMA ($0.62610) and R2 ($0.6284). However, failure to move through the 200-day EMA ($0.62389) would leave S1 ($0.6216) in play. A move through the 50-day EMA would send a bullish signal.
About the Author
Bob Masonauthor
With over 20 years of experience in the finance industry, Bob has been managing regional teams across Europe and Asia and focusing on analytics across both corporate and financial institutions. Currently he is covering developments relating to the financial markets, including currencies, commodities, alternative asset classes, and global equities.
Did you find this article useful?
Latest news and analysis


Advertisement