Risk traders leaning against the highs....
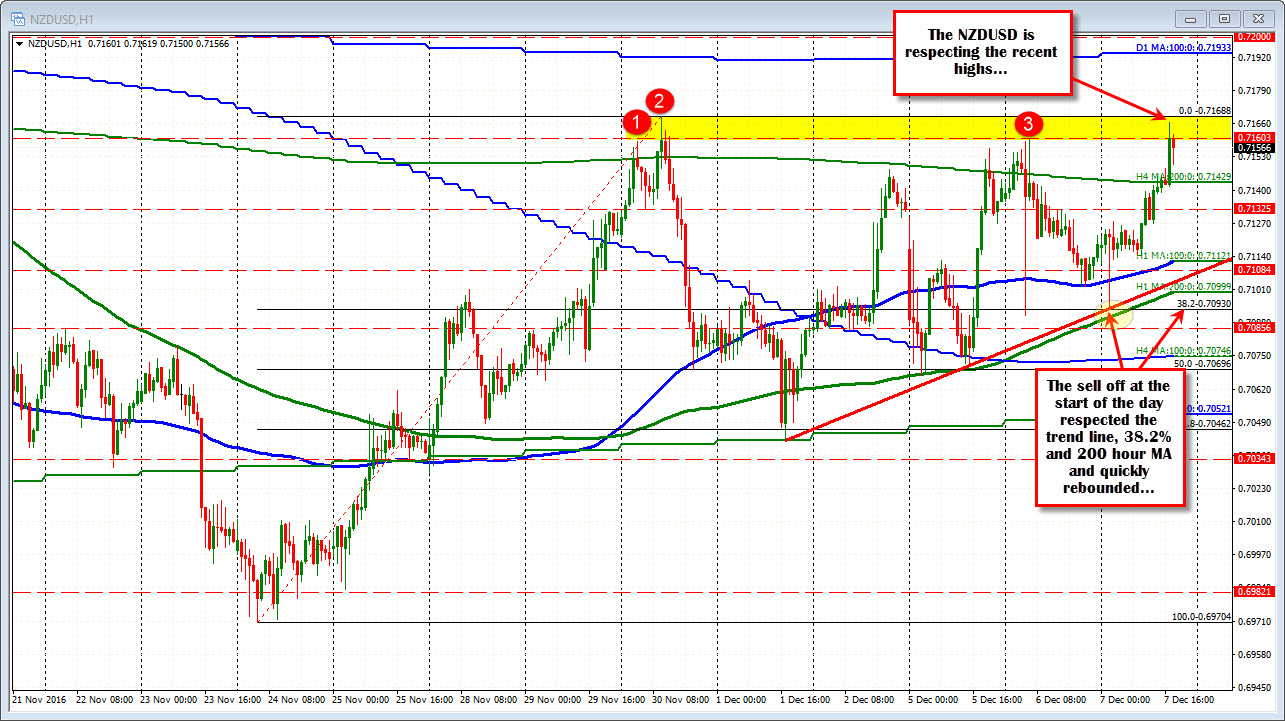
The NZDUSD followed its sibling AUDUSD lower after the surprise Australia GDP (-0.5%). The fall bottomed against the trendline/38.2% retracement/200 hour MA (green line in the chart below) and quickly rebounded.
From that base, and realization that it does not need to follow the close neighbor, the price started to rally back higher. It even may have helped to drag the AUDUSD higher as well (ironically).
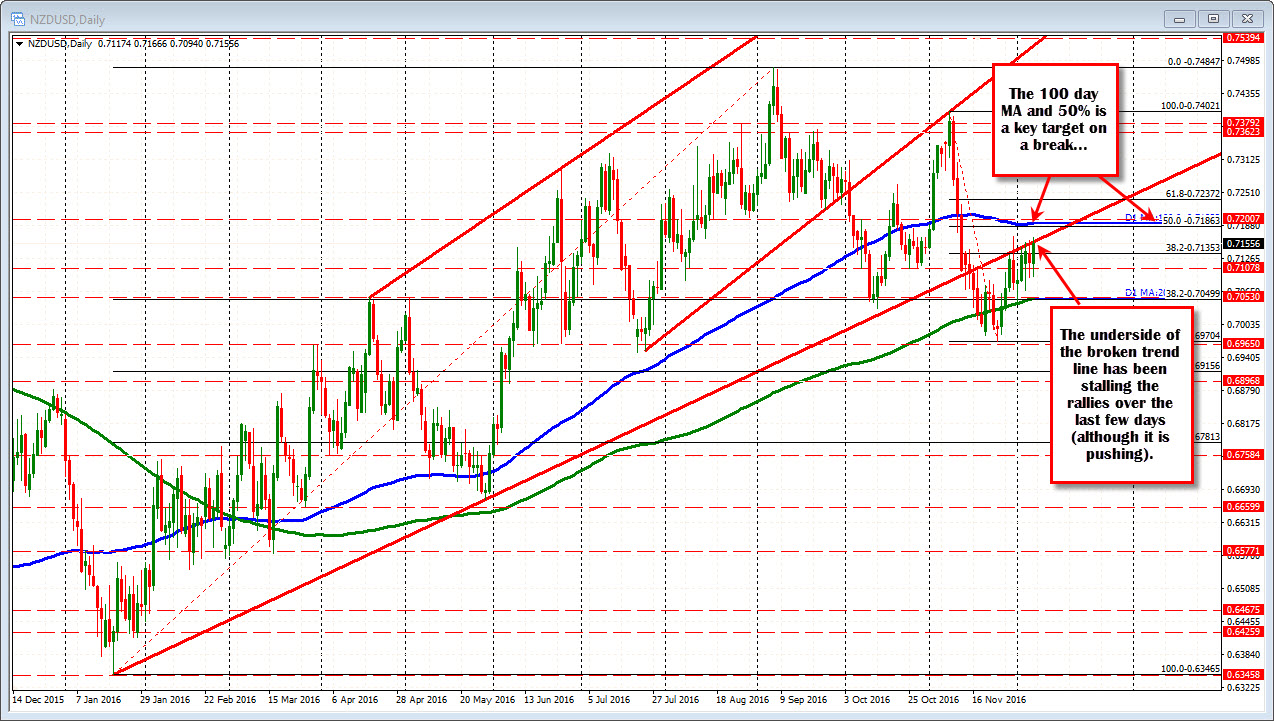
Anyway, the rally has continued in the US session and the pair has moved to test the highs from yesterday at 0.7160 and the high from last week at 0.71688. Looking at the daily chart below, the rally has also tested the underside of a broken trend line. There is some reluctance. Like the respect at the lows today, there is respect for the area at the top. Traders are leaning.
Now the buyers do remain in control. The pair is more supported. I could see more of a a break higher than lower. If so, there is another risk defining area above that comes against the 100 day MA and the 50% retracement of the move down from the November high. That area comes in at 0.7186-934. Although it is not that far from the most recent high at 0.71688, look for sellers to lean on a test, with stops above it. The risk can be defined. The risk can be limited and that makes for interest from traders looking to skew the risk/reward profile in their favor.
Sellers - by the way - feel more comfortable on a move back below the 200 bar MA on the 4 hour chart at 0.71429. A move below that level neutralizes some of the bullish bias seen in trading today (see hourly chart above).