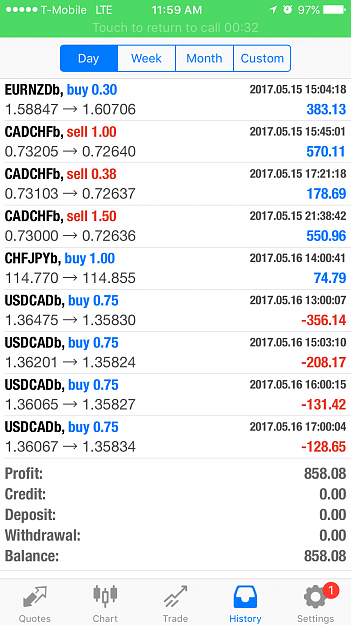
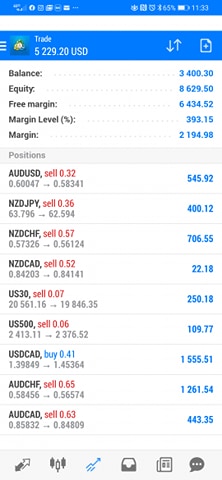
Closing all my trade now. Looking for another opportunity. Always remember, market always wrong so don't trust him so much. Hit your target and move on.
Hi Jackson,
Could you please clarify the trade setup for me?
Let me know if I got this right (example for going long):
Entry Conditions:
1. Weekly trend: AO & AC green bars (regrdless of their position to the zero line)
2. Day chart confirmation: AO to be green. Does it have to be positive (above the zero line)?
3. H4 chart pullback: AC must turn from red to green. I'm assuming here, to consider a valid pullback AC must be negative (under the zero line); correct?
4. H1 entry trigger: enter if price goes above the high of the H4 candle from H4
Do you have hard targets or you just trail the stop based on AO/AC?
Hi Jackson, Could you please clarify the trade setup for me? Let me know if I got this right (example for going long): Entry Conditions: 1. Weekly trend: AO & AC green bars (regrdless of their position to the zero line) 2. Day chart confirmation: AO to be green. Does it have to be positive (above the zero line)? 3. H4 chart pullback: AC must turn from red to green. I'm assuming here, to consider a valid pullback AC must be negative (under the zero line); correct? 4. H1 entry trigger: enter if price goes above the high of the H4 candle from H4 Do...
Ignored
Hi there,
Weekly chart = you got it right
Day Chart = If AO is above zero line, it can be red but AC must be green. If AO is below zero line must be green.
H4 = If AO is above zero line, it can be red or green. If AO is below zero line, wait for AO to turn green and wait for H1 to breakthrough the 1st AO (below zero line) highest high with candle close top 25% of the candle. If AO is above zero line, use AC to trigger entry, I will only use the first wave ( when AC is below zero line and turn green).
H1 = Most important sign, candle closet price must be top 25% of the candle.
TP: I usually use 1:5 (if SL is 25 pips, TP will be 100 pips. I round down the number to the nearest whole number and times 5)
SL: I never put a actual SL only when I go bed. I draw a line at where my SL is and if H1 candle breakthrough the line I drew, I close the trade. If trade is winning 1:1. I will put a actual SL at the entry level (maybe a few pips higher than my entry level).
Close trade condition: When my trade is winning but H4 AO turn red above zero line and 2nd red AO onward if candle close lower than the 1st red AO candle. I will closet trade.
This may seem like hardly got any opportunity to enter any trade but if you looking at what I'm looking. You will have min 3 to 4 good quality trade with I believe 80% rate of TP.
I actually trying to focus on M15 chart. Account drop to 600 plus. But I think I figure out how to handle M15 after losing a few trade.
FOR LONG TRADE
Indicator use : AO, AC and 50SMA
Chart : Weekly (depend on day chart AO, AC and where is the candle of the day chart)
Main Chart : Day chart
Up trend - candle must be above 50SMA , AO must by above zero line (regardless of the color), if AO below zero line (AO must be green), AC must be green and with 1st 4 bar (regardless it above or below zero line). When AO is above zero line green and AC is above zero line show red, use weekly chart to determine the trend. Weekly chart AO and AC must be both green.
Secondary chart : H4
candle must be above 50SMA , AO must by above zero line (regardless of the color), if AO below zero line (AO must be green), AC must be green and within 1st 4 bar (regardless it above or below zero line). When AO is above zero line green and AC is above zero line show red, use day chart to determine the direction.day chart AO and AC must be both green.
Secondary Chart : H1
candle must be above 50SMA , AO must by above zero line (regardless of the color), if AO below zero line (AO must be green), AC must be green and within 1st 4 bar (regardless it above or below zero line). When AO is above zero line green and AC is above zero line show red, use day chart to determine the direction.day chart AO and AC must be both green.
Trigger Chart : M15
When AO is below zero line, wait for 2nd green bar and close higher than 1st bar candle.
When AO is above zero line, use AC 1st bar and when the candle close higher than previous candle. ENTER
Regardless candle is above or below 50SMA
Exit : When trade is entered, use H1 chart to determine exit
1) When candle close below 50SMA (full candle)
2) When AO crossover from above zero line to below zero line and 2nd bar is close lower the 1st AO bar below zero line.
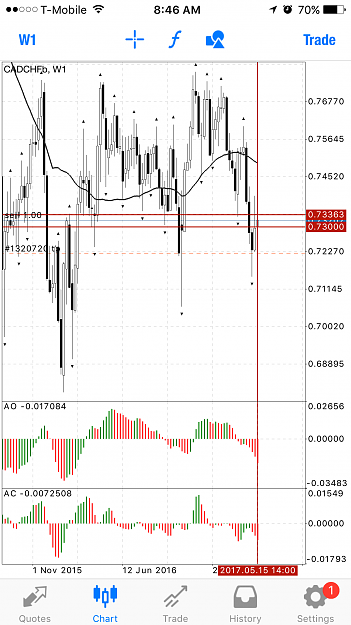
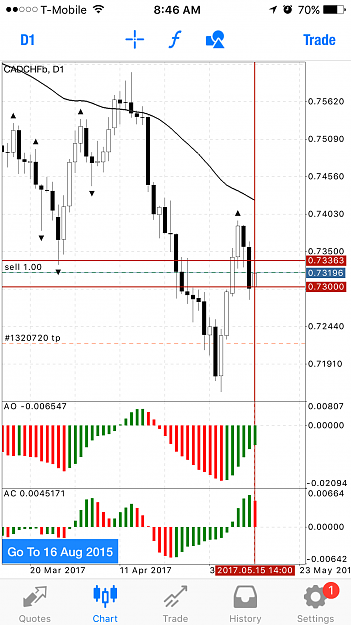
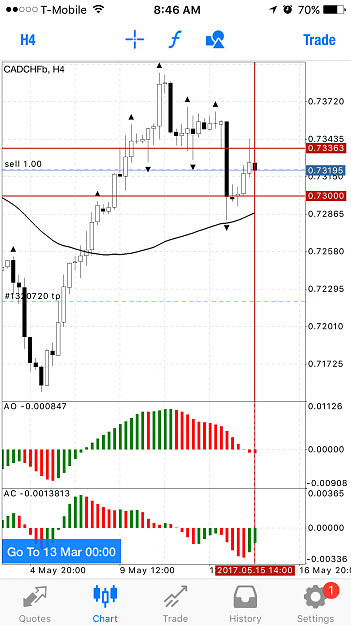
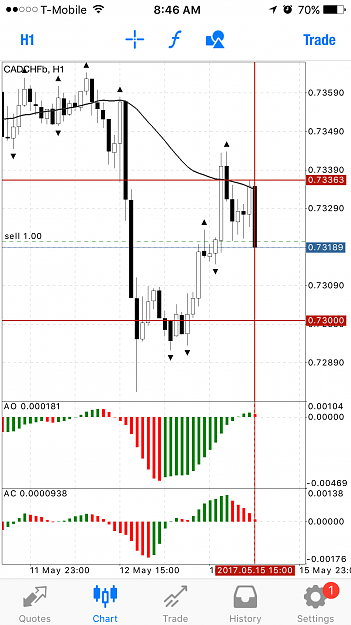
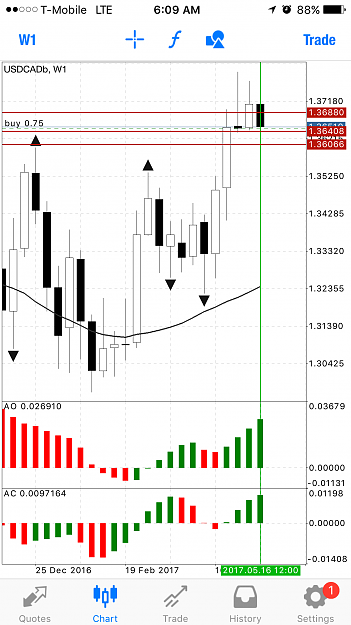
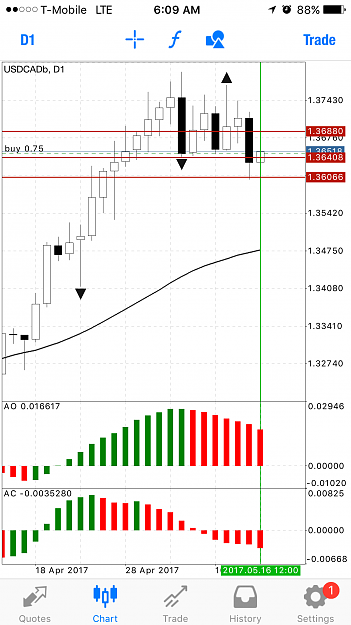
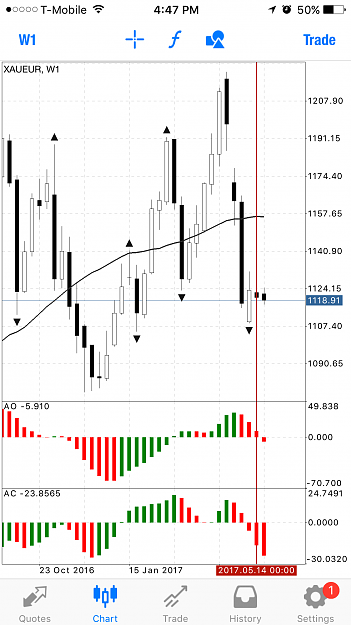
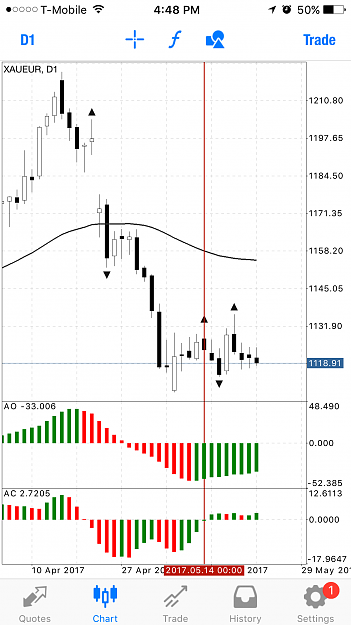
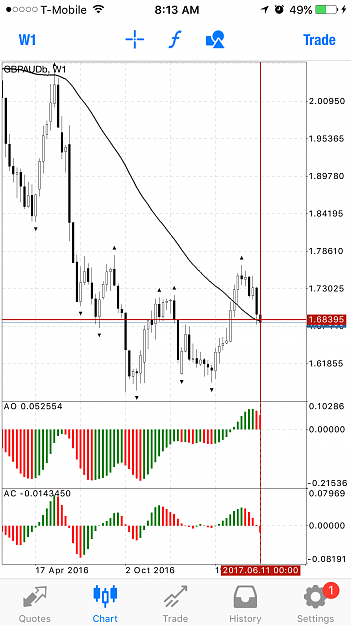
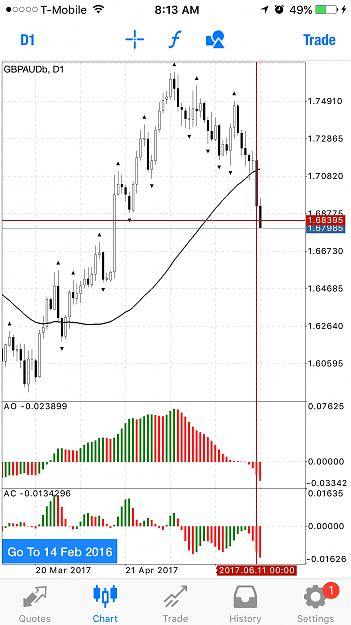
1) Day chart candle is below 50SMA, AO is below zero line and AC is above zero line. Because weekly chart showing both AO/AC is red so clearly is a down trend and is just pulling back.
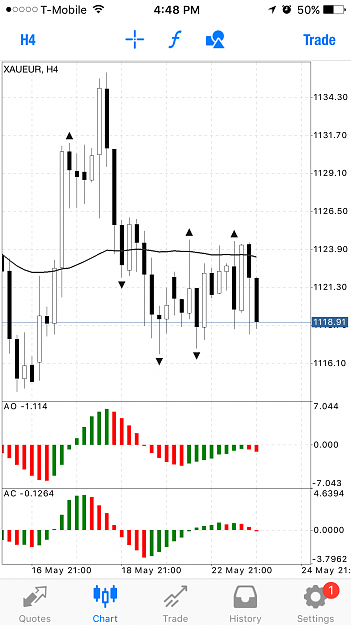
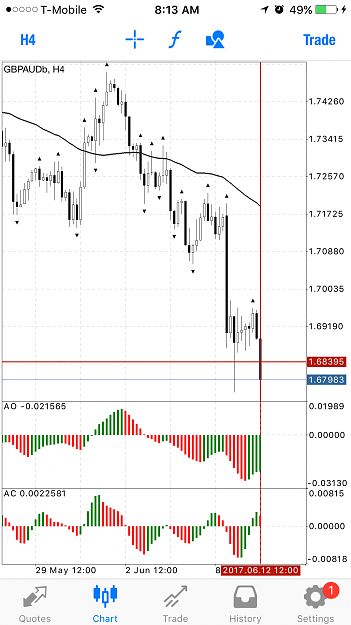
2) How to know when is the pullback going to be end?
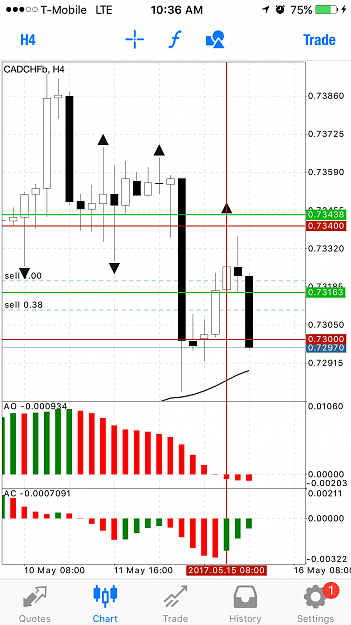
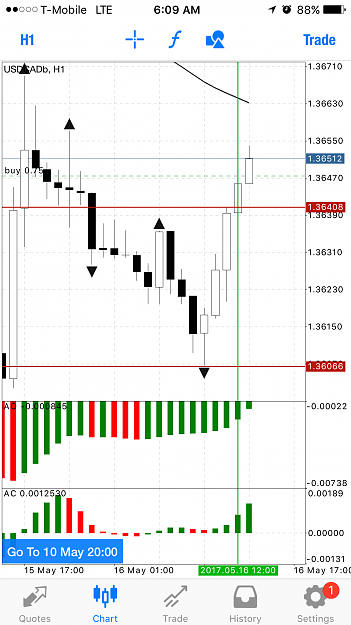
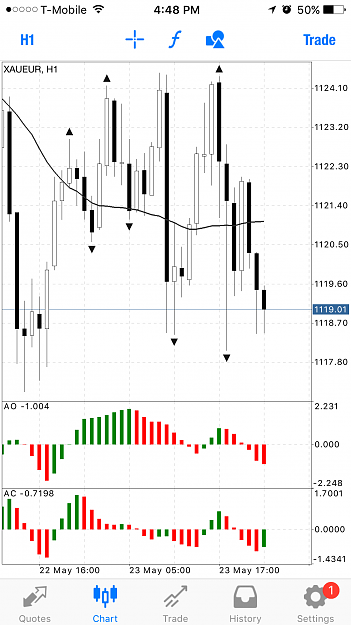
I'm using H4 chart. Candle is below 50SMA , AO is below zero line and AC is showing red bar from above zero line. This show that I can move to my H1 chart to see is this H4 chart going down more.
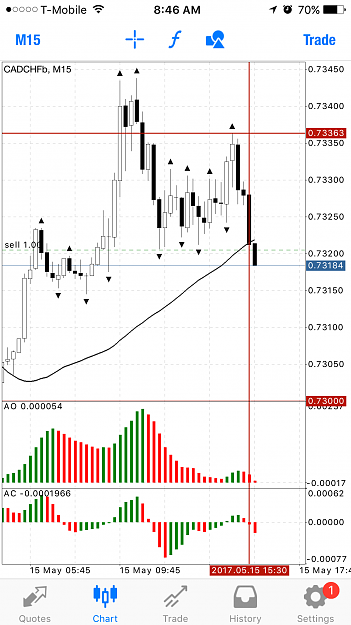
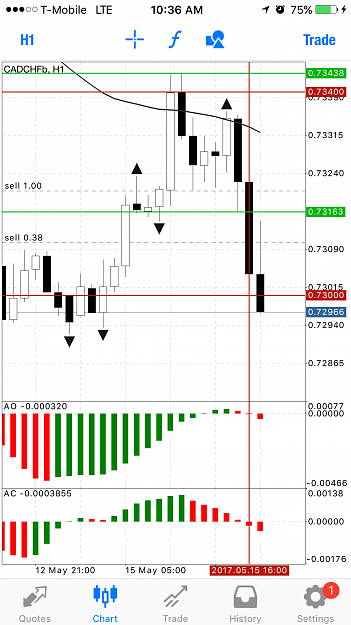
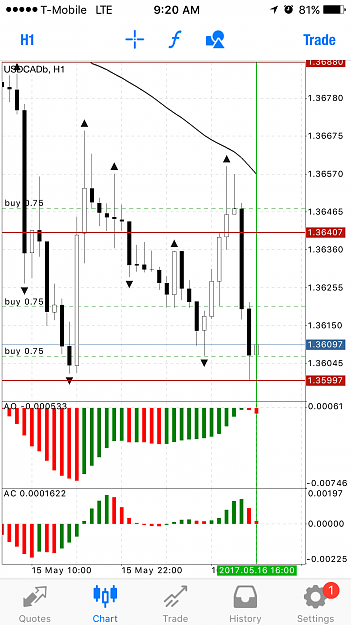
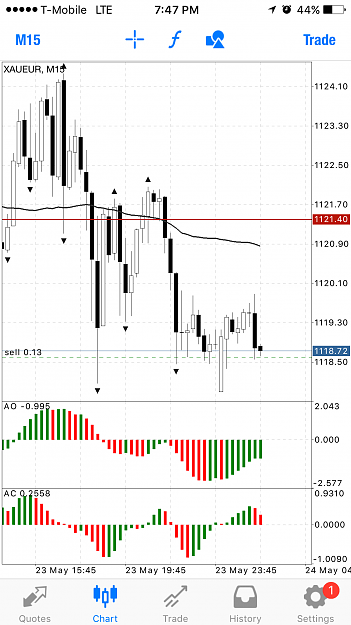
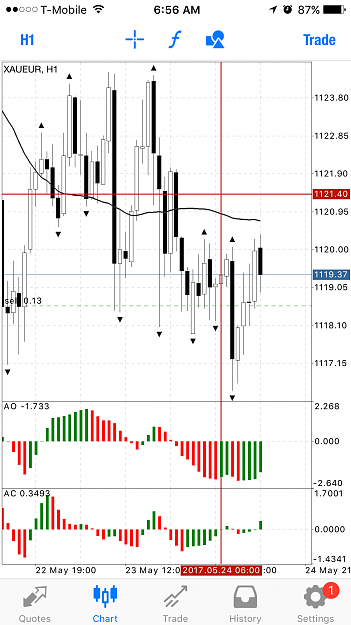
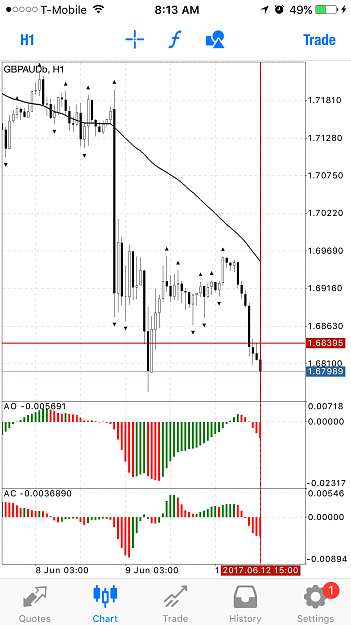
3) H1 chart same situation, candle is below 50SMA, AO is below zero line and AC is move from top to bottom. If later H1 AC move above zero line but H4 and day chart remain same setting. Wait for H1 AC turn red above zero line and move to M15 to look for entry.
I'm currently in NYC, so I will wait till 7pm my time (Asia market open) to look for opportunity. Happy trading guys
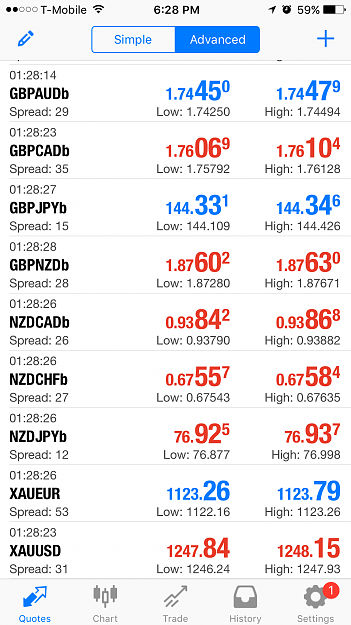
{image}{image}{image}{image} This is an example for going short. 1) Day chart candle is below 50SMA, AO is below zero line and AC is above zero line. Because weekly chart showing both AO/AC is red so clearly is a down trend and is just pulling back. 2) How to know when is the pullback going to be end? I'm using H4 chart. Candle is below 50SMA , AO is below zero line and AC is showing red bar from above zero line. This show that I can move to my H1 chart to see is this H4 chart going down more. 3) H1 chart same situation, candle is below 50SMA, AO...
Ignored
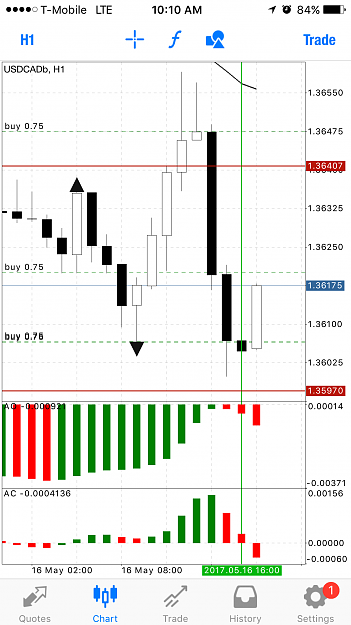
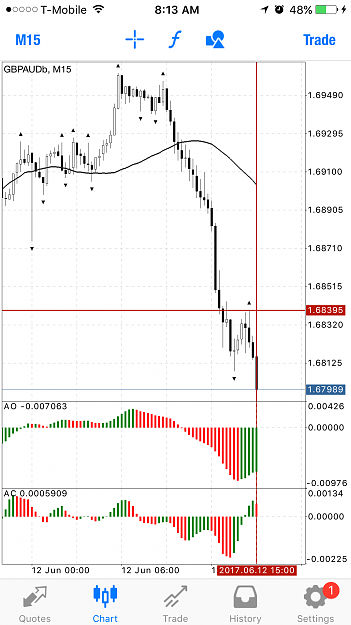
Enter at M15
H1, H4 and day same setting.
Target TP 200pips. Unless H1 candle crossover than I exit the trade.
I burned my previous account, take a break and ready to challenge this again. Back into the market in Feb 2020 and so far so good. That's why I'm ready to carry on this post.