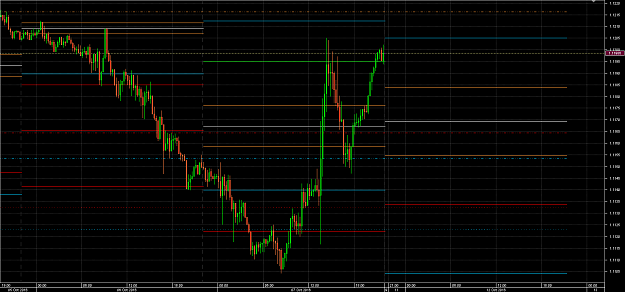
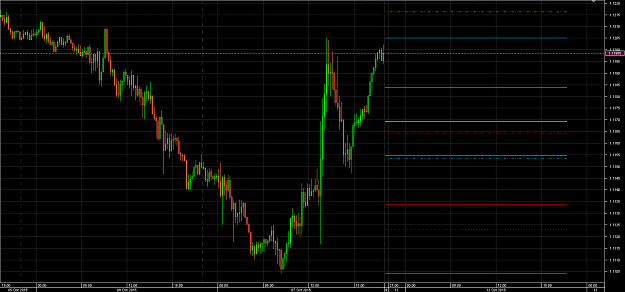
I've made a first version (i'm not satisfied yet with it but it does what i pretend for now) of the pivot levels indicator for jforex where it draws the following levels:
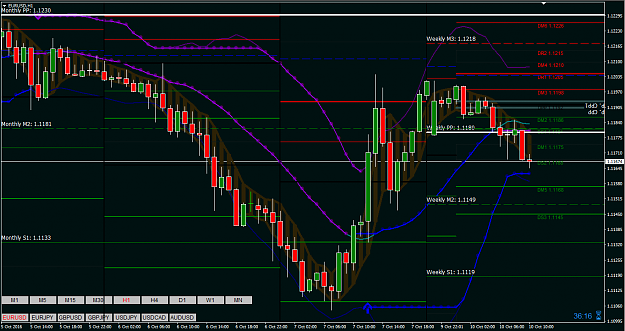
Monthly pivots of last month plus PH/PL/TC/BC (dot lines)
Weekly pivots of last week plus PH/PL/TC/BC (dash dot dot)
and the same on daily (line) at same time
[edit]Historic values are draw depending on timeframe selected (daily till monthly). Default daily.
If someone is interessed i will share it.
JL
Attached Image(s) (click to enlarge)
Started a blog: terraceman blogspot com