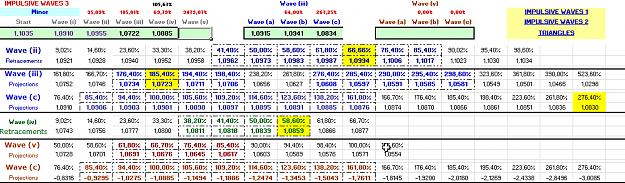
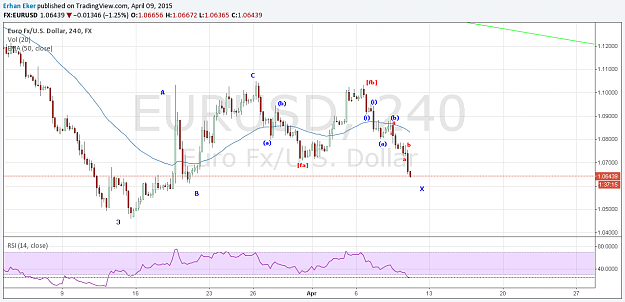
{quote} Is this what you have? ps. Please can you next time publish your sheet... only then we can quickly see the ratio's. Now I do have to make it for our judgement {image}
Ignored
Sorry. I will when I get home. Wave (ii) at 1.0955 not 1.0995
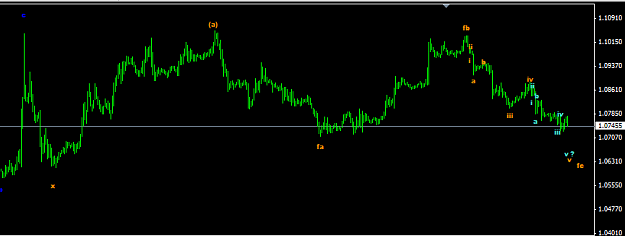
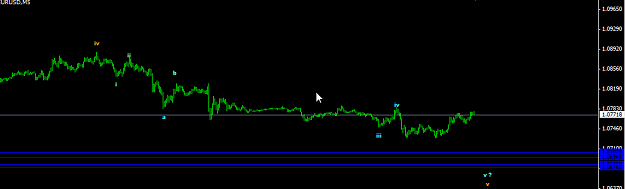
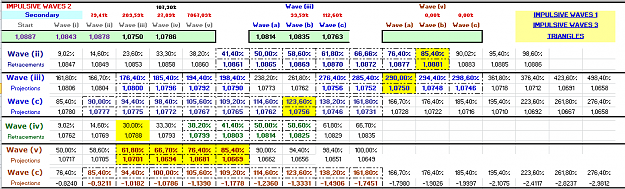
Well I think this is the count we need to follow now...
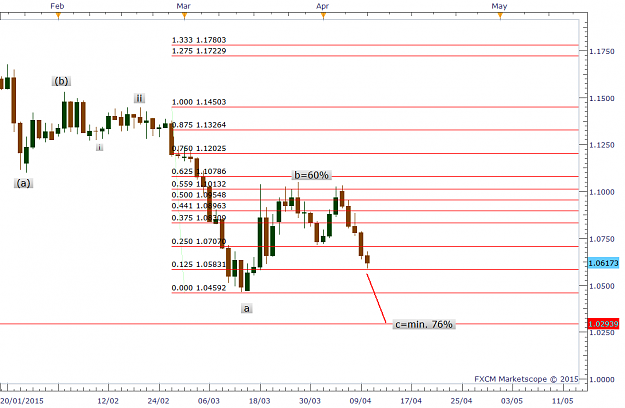
first image => current count
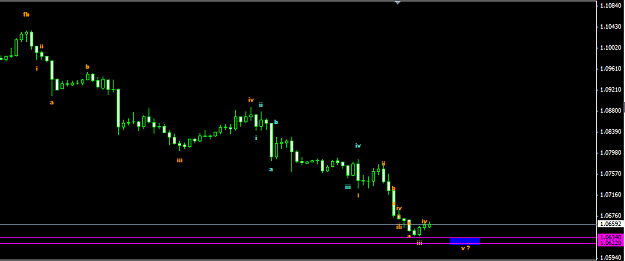
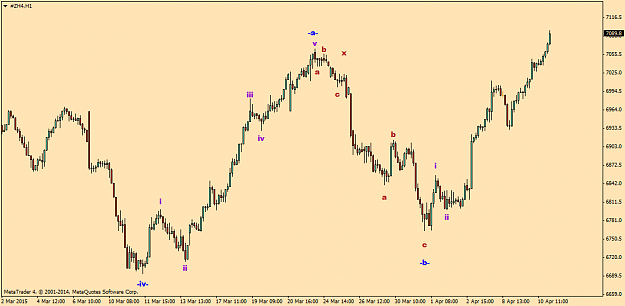
second image => measurments
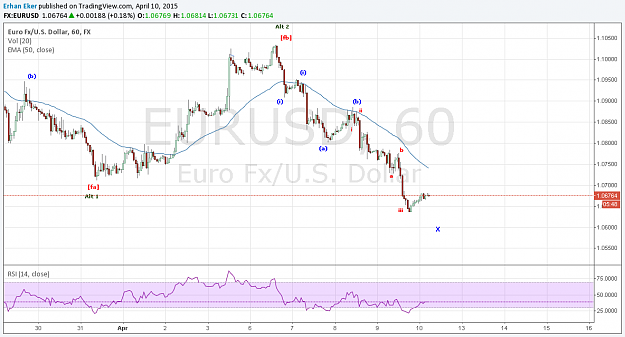
thirth image => is the current wave v of wave fc
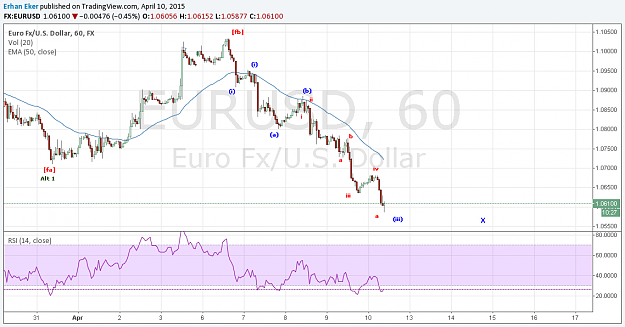
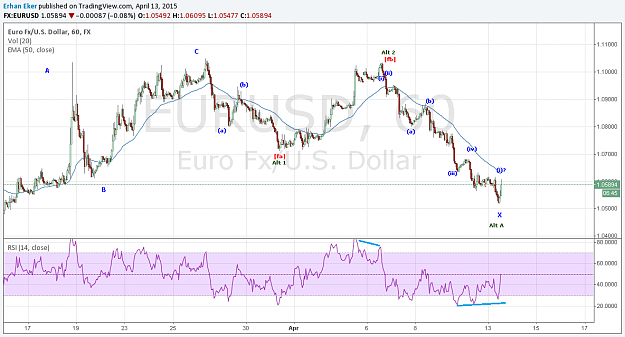
fourth image => measurments of current wave v of wave fc
Attached Image(s) (click to enlarge)
You can manage risk, but you can't manage the return
Well I think this is the count we need to follow now... first image => current count second image => measurments thirth image => is the current wave v of wave fc fourth image => measurments of current wave v of wave fc {image} {image} {image} {image}
Ignored
Possible. I have several Bollinger bands at 1.0685-95 area.
I measured the fc-wave included the wave-v of wave fc and if I did it right then I think the down move is nearly over.... I come to a (normal) holding area between 1,0634 - 10 after that I think we need the up-move for finishing wave -b- ........
But....everyone is incredible bearish, we had a SHS-formation where the neckline is broken, we have in the daily a double top...even the 4H MACD system is saying downdown.....and price looks oversold ... Maybe yourcount is better I don't know anymore ... your more bearish then I am in the HEW count ( in count, I mean in my brean it only is saying...downdowndown ) But somewhere I read that the Fc wave can be 100 to 162% the length of wave fa....if this is true....then yes it can be much more bearish then I counted.... But I can't count it at an otherway....
Well it looks like we are against the nature of things.....but if my count is right then HEW is now saying the opposite...indeed...
....it is just waiting untill the market will show his personality, I think....
Attached Image (click to enlarge)
You can manage risk, but you can't manage the return
{quote} Hi almondeyed, I measured the fc-wave included the wave-v of wave fc and if I did it right then I think the down move is nearly over.... I come to a (normal) holding area between 1,0634 - 10 after that I think we need the up-move for finishing wave -b- ........ But....everyone is incredible bearish, we had a SHS-formation where the neckline is broken, we have in the daily a double top...even the 4H MACD system is saying downdown.....and price looks oversold ... Maybe yourcount is better I don't know anymore ... your more bearish then I...
Ignored
Momentum is too strong to look for Wave v around here unless there is a climatic reversal (no sign of it and no upcoming news to cause this). In my count [fa] is very clear three waves. So either we are correction down for more upside or it is First wave of very big another down move. I favor 1st.
{quote} Momentum is too strong to look for Wave v around here unless there is a climatic reversal (no sign of it and no upcoming news to cause this). In my count [fa] is very clear three waves. So either we are correction down for more upside or it is First wave of very big another down move. I favor 1st. {image}
Ignored
I'm agreed with you....
double top is real bearish I think and some other signals are also bearish
Look in de day cahrt and I have the feeling we need to go down first until the start of this move....around 1,04 -05 I guess.... after that we still need a big upmove... anyway untill no I can't match HEW with it...well I'm studying again
If you have some valid count/measurments...let us know, I will do the same
You can manage risk, but you can't manage the return
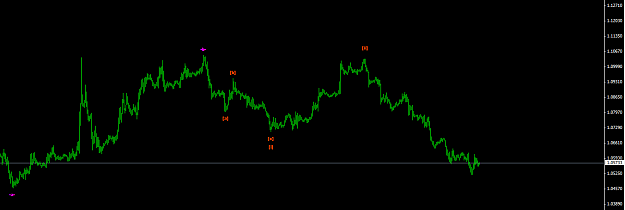
if current low hold (it means it is blue Wave (iii)), we may go 1.0770 before next lower low. But i guess one more lower low should come before this. {image}
Ignored
Agrred with you...
If I count it.... then we need to go first to 1,0529 before (only alternation wave iv is only 61,8%...still looking for another intern wave a and b..)
You can manage risk, but you can't manage the return
{quote} Agrred with you... If I count it.... then we need to go first to 1,0529 before (only alternation wave iv is only 61,8%...still looking for another intern wave a and b..)
Ignored
Maybe we seen the low at 1,0567 of wave iii.... we also see divergence at 1 hour chart, MACD pointing upwarts.
Yes it's plausible.....
You can manage risk, but you can't manage the return
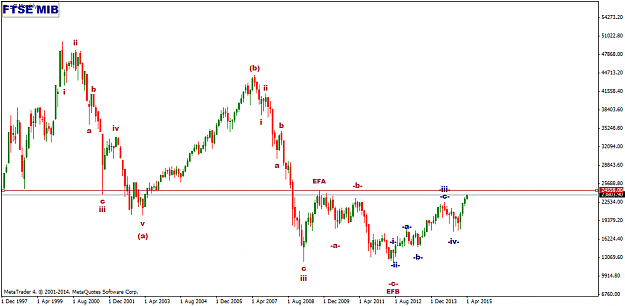
FTSE 100 Looks like the final push higher. I'm keeping an eye on the CAC and FTSE MIB. Looks like an ABC correction in the CAC from March, 2008. A 161% projection in wave C would get to 5448. The FTSE MIB seems to be moving up in an expanded flat wave efc. The wave efa was 24558. {image} {image}
Ignored
Do you combine the CAC and FTSE MIB then into your trading decision?....what is the relation between them?
Still can be the wave iv.... 1,0583 can be a line in the sand for wave ii in wave iv....
You can manage risk, but you can't manage the return
{quote} Do you combine the CAC and FTSE MIB then into your trading decision?....what is the relation between them? Still can be the wave iv.... 1,0583 can be a line in the sand for wave ii in wave iv....
Ignored
Troughs across markets are usually synchronized whereas peaks are not. But given that the next top is likely to be the last for a long time I think the sell off will be synchronized and therefore the peaks will likely occur close together.
{quote} Well the line in the send for me....1,0583 is broken.... I think we really have to consider that we indeed had our -b- wave already at 1,10520 @4Xpol: I think your count is at the a good track..... how are your projections look like?
Ignored
Looking for wave iii to get to 1.0150-70 or 0.9990-1.0025.GL
Hi Almondeyed.... I'm still thinking between the flat solution (what I was following last friday) or the solution that we already had wave -b- (as 4xpol is following)
For the first solution the bearish view has to be halted at +/- this stage...
In the second solution we have a really bearish view and have to go a long way down... that is also in synchro with the double top we had. 4H MACD looks also bearish. The day-chart at it is giving a sign of recovery (price went above and after below ema21, and normally tries to break the sma89 again, but in a few pips the price is again below the last low and this rule is getting a "reset". if we read technical articles it also looks not good for the euro at the moment.
last friday I also was measuring the move you have...and indeed I also had problems with alternation.
In the second view it looks if it is fitting better....
Attached Image (click to enlarge)
You can manage risk, but you can't manage the return