Thought I'd share something I do to help visualize a trade and keep my
ducks in a row.
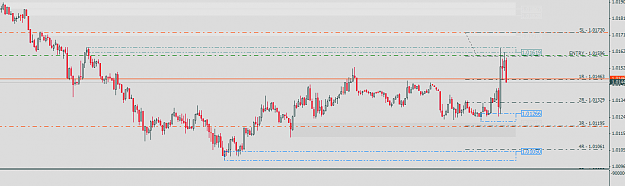
Attached Image (click to enlarge)
As you can see in the image I've abused the fib expansion tool for my own
specific use by setting up the extension levels as multiples of the first level.
This way I can place the A and B (and C) points of the fib extension on my
entry and stop loss levels and get a nice visual of R multiples to see if the
trade is worth it and if so what my R:R is.
This has kept me out of a lot of iffy trades (which is what puts you on a bad
run if it gets out of hand).
As you can see in the image I've abused the fib expansion tool for my own
specific use by setting up the extension levels as multiples of the first level.
This way I can place the A and B (and C) points of the fib extension on my
entry and stop loss levels and get a nice visual of R multiples to see if the
trade is worth it and if so what my R:R is.
This has kept me out of a lot of iffy trades (which is what puts you on a bad
run...