Just wanting to say thanks. Post like this are very educational.
I have been silently following you since you started the "My path to financial freedom" and have learned a lot from you. It´s great inspiration to see how you have matured to a full time trader.
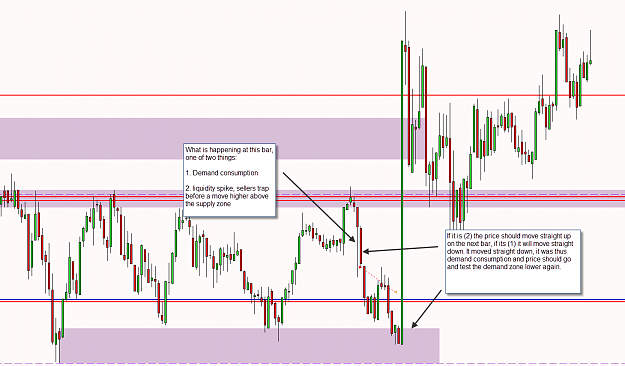
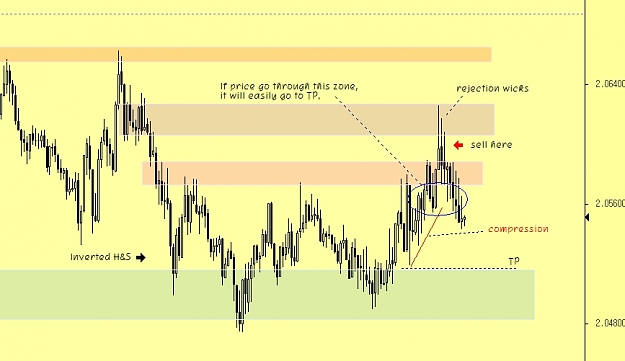
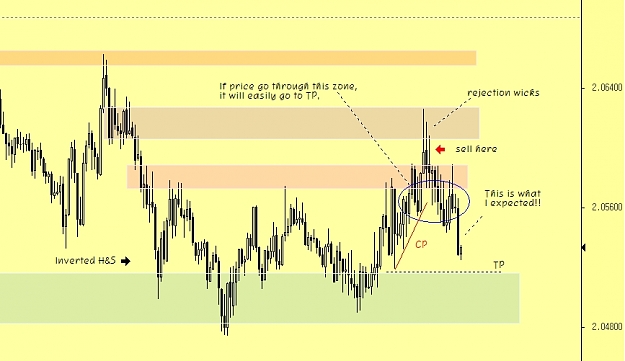
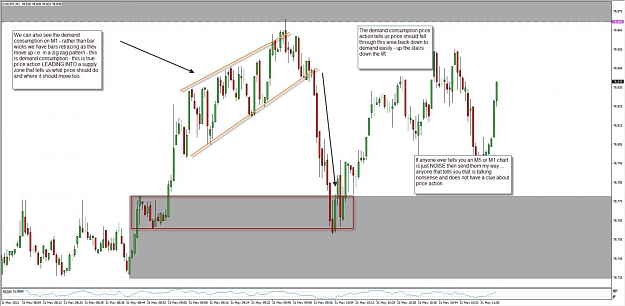
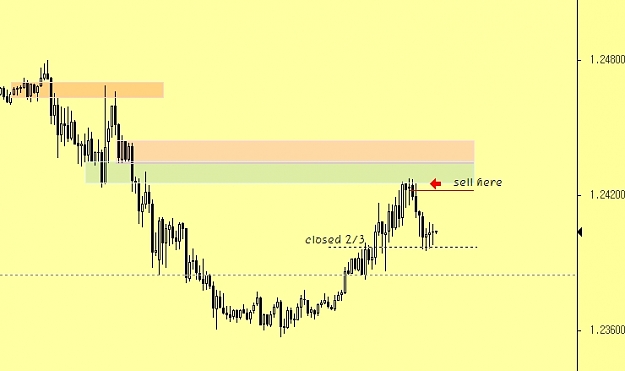
The area I've marked in the chart below was compression...price compressing as it rises and dipping as it rises (see the wicks below the bars) means demand consumption.
In terms of Flags what is your definition of a Flag?
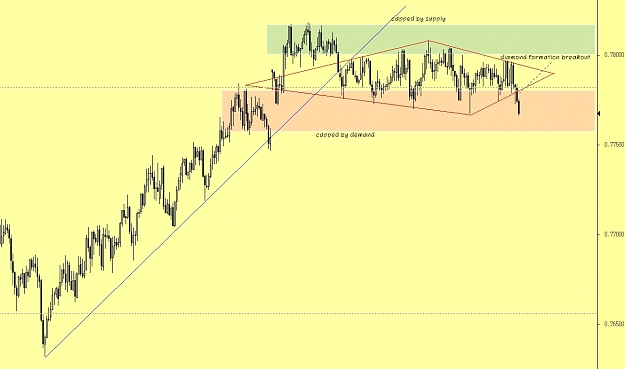
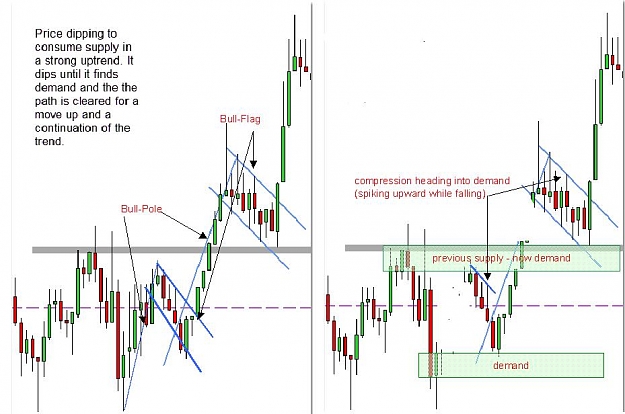
Below is an example of what I would call a Bull Flag (taken from the free video on my website which describes common price action patterns).
Ignored
Hi Fx7877,
Different people see one thing in different ways. This is my viewpoint. Look at the second chart on the right. I erased the bull-poles from the original chart. How do the bull-flags look now? I hope you will understand what I mean.
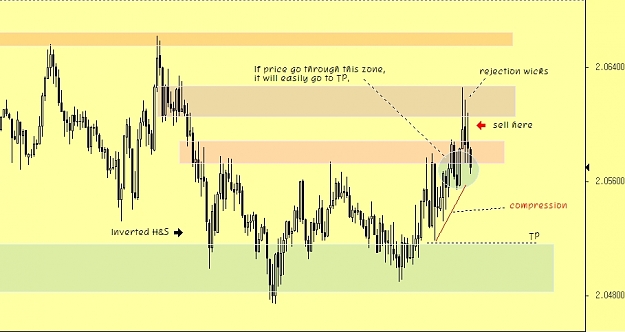
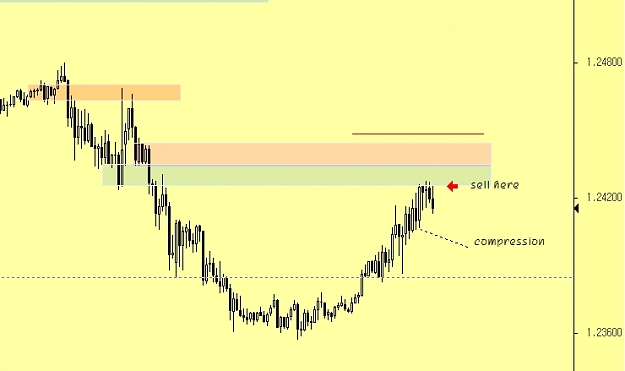
What do we want to know from compression?
compression heading into demand - not many sellers there
compression heading into supply - not many buyers there
Different people see one thing in different ways. This is my viewpoint. Look at the second chart on the right. I erased the bull-poles from the original chart. How do the bull-flags look now? I hope you will understand what I mean.
What do we want to know from compression?
compression heading into demand - not many sellers there
compression heading into supply - not many buyers there
Hope it helps.
Ignored
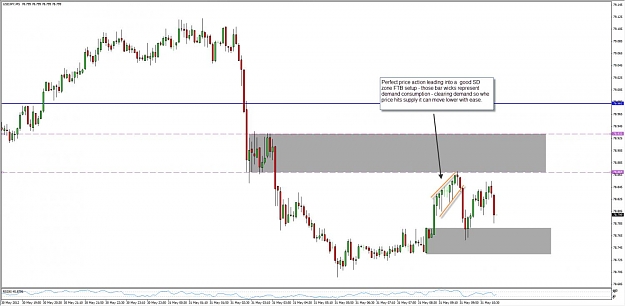
- I should have added Price dipping and spiking to consume supply.