Ifmyante, please comment my post http://www.forexfactory.com/showthread.php?p=5548651#post5548651
Ignored
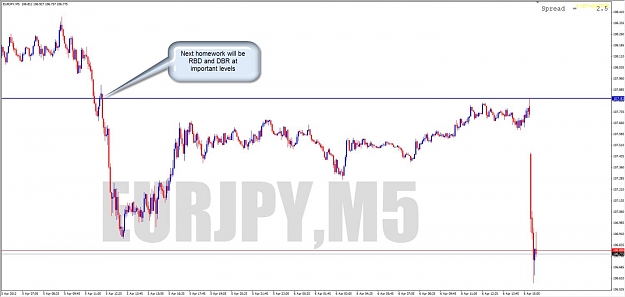
Here you go. You can consider your black line to have been pre-tested, and the spikes above blue box tested, and the clear D within it used as Supply already.
While you're looking for CP, take the time to find at least 20 CP&L (Liquidity) too
If you're not used to these, you can get stopped out of some...
Ignored
Definitly my fault, but i still don't understand exactly what compression is.
I'am reading the red stuff here (https://sites.google.com/site/rtp505/home/articles/price-compression) here and in the romancing the price treadh; we are talking, if i am reading correct, about an rising/descending triangle that spikes south [if the wedge is a rising] or north [descending wedge] "consuming itself" directly into supply or demand zones.. but i could't see it in your chart.
Sometime the horizon disappear. Twitter: @_whiteout
Definitly my fault, but i still don't understand exactly what compression is.
I'am reading the red stuff here (https://sites.google.com/site/rtp505/home/articles/price-compression) here and in the romancing the price treadh; we are talking, if i am reading correct, about an rising/descending triangle that spikes south [if the wedge is a rising] or north [descending wedge] "consuming itself" directly into supply or demand zones.. but i could't see it in your chart.
Ignored
Just see in the LTF that every supply formed had their sell orders filled by the spikes up as price moved down
Joined Mar 2012
|
Status: jack of all trades master of none
|277 Posts
The best think that i can do is put my head into the chart, 20 example of this are hiding somewhare.
tnks for the time that you are spending here and enjoy your holiday.
Sometime the horizon disappear. Twitter: @_whiteout
The best think that i can do is put my head into the chart, 20 example of this are hiding somewhare.
tnks for the time that you are spending here and enjoy your holiday.
Ignored
Thanks
and if I don't see you all through the week, have fun and stay safe
im currently working on a e-book about supply/demand trades, risk and moneymanagement and a lot more...
this is the very demo version, still under construction...i plan to invest a few more weeks before i publish it.
Please let me know which topics you'd like to have discussed in detail, il try to include em then.
password for the pdf:
'' Ifmyante ''
the e book will be for the newcomers and semis that want to improve their trading.