• Home
  • Forums
  • Trades
  • News
  • Calendar
  • Market
  • Brokers
  • Login
  • Join
  • User/Email: Password:
  • 7:37am
Menu
  • Forums
  • Trades
  • News
  • Calendar
  • Market
  • Brokers
  • Login
  • Join
  • 7:37am
Sister Sites
  • Metals Mine
  • Energy EXCH
  • Crypto Craft

Options

Bookmark Thread

First Page First Unread Last Page Last Post

Print Thread

Similar Threads

Trading with Price Action - Daily Trading Analysis 80 replies

Daily Highs and Lows to Previous Daily Highs and Lows 1 reply

dx and ex daily and EU daily 2 replies

Day Trading vs. Swing Trading vs. Position Trading 84 replies

GBP/USD daily pip movement vs. EUR/USD daily pip movement 3 replies

  • Trading Systems
  • /
  • Reply to Thread
  • Subscribe
  • 80
Attachments: Trading the Daily
Exit Attachments

Trading the Daily

  • Last Post
  •  
  • 1 56Page 789 15
  • 1 6Page 78 15
  •  
  • Post #121
  • Quote
  • Mar 25, 2008 9:56pm Mar 25, 2008 9:56pm
  •  Bobokus
  • | Commercial Member | Joined Oct 2006 | 2,560 Posts
Quoting schmurex
Disliked
Hi Bob,
I hope your health is better…
Sorry, I was travelling for the last 2 weeks and had very limited internet time.
I’m still testing my ‘H4 scalping technique’ with more and more confidence (still demo)... I have started to forward test it on 8 pairs. It requires monitoring the trades at the opening of each H4 candle (I usually miss one during the night).
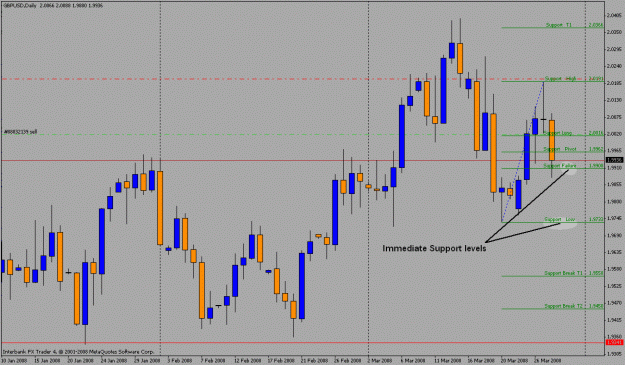
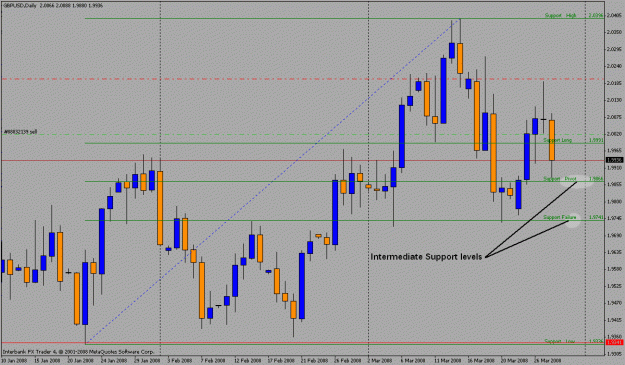
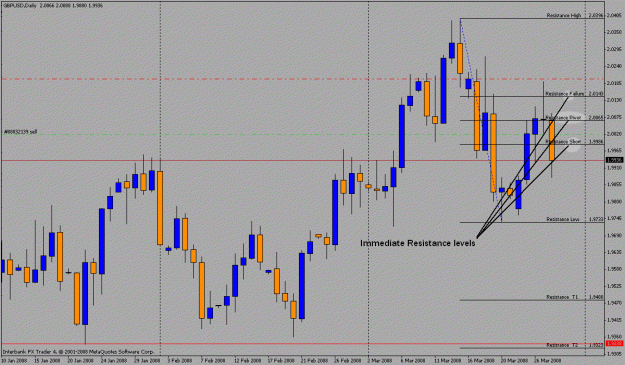
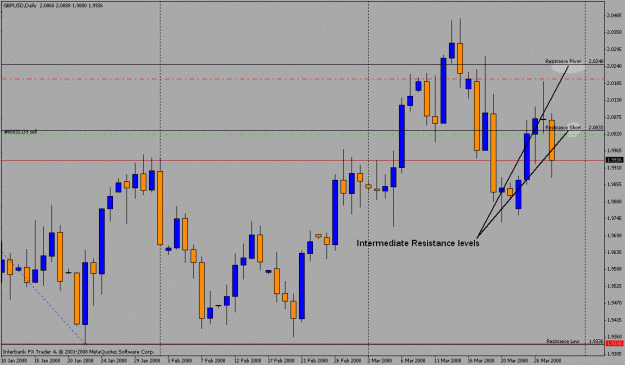
I’ve also tried the Daily with mixed result, still positive but I feel like we’re almost trying to get in the same trades that in your other thread but from the daily chart, with less information (missing the inner S/R). I was wondering if monitoring the D1 wouldn’t mean to trade the monthly from the daily candles as you trade the daily from the H1 candles in your other thread? Let me explain my reasoning:
For H4 I put cycle lines from Monday to Monday (or Sunday to Sunday) to materialize the week. 1week is 30 H4 candles which is very close to the 24 H1 candles in the day so instead of playing the intra-day fib and the swing fib, I play the ‘intra-week fib’ and the swing fib. So I trade the same way that you do in your Fibonacci thread although I use most of the time the break out of the swing fib (what you call scalping), but I monitor how price react to the inner fibs of the Intra-week fib and also to the retracement fib, up-trend fib, downtrend fib, range fib and so on.
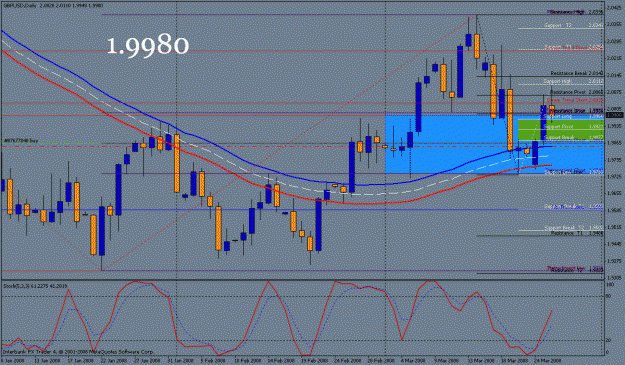
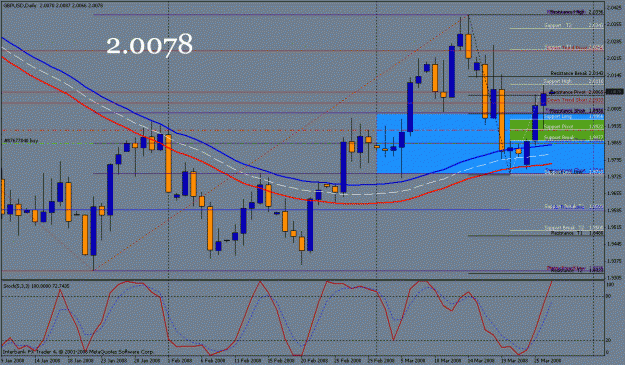
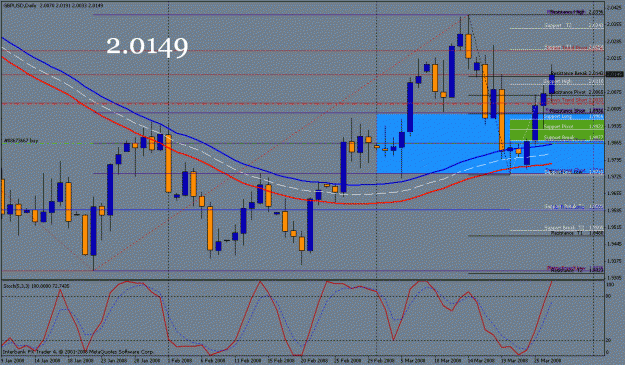
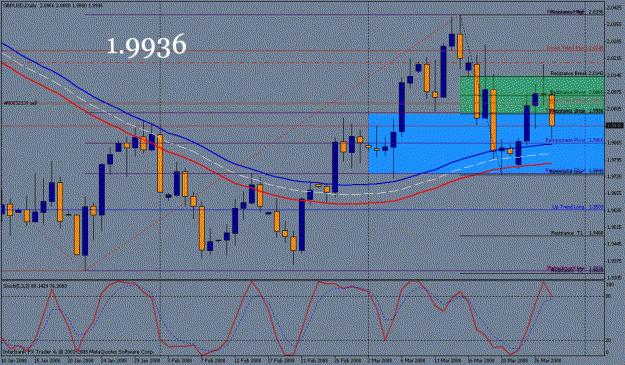
For the Daily I tried to replicate that but since the month never match with the weeks I added some cycle lines every 4 weeks which makes for a Lunar Month with 13 LM in a year 13 x 4 = 52 weeks. Once again 4W x 5 candles (6 if there is a Sunday candle) = 20 or 24 candles, very close to the daily technique. I don’t respect strictly the limits of the LM but find good Top/bottom around them, the main purpose of the LM is to give a scale on which to gauge P/A. I pretty much fib each bar except the inside bars. Actually on the bigger bars I sometime set my SL at the 38 or 62 level and not at the top/bottom or look for good S/R in H4.
But maybe I should take even less trades but out of the LM fib as you do with the intraday fib?
Please give me your view on that.
I usually open 3 trades at the Break-Out of the fib. If the B/O is set at 68/32 then TP1 is 0/100 and initial TP2 is at 138/-38 it then move with the fib to T1. If the B/O is 0/100 TP1 is at 138/-38 and initial TP2 is at 200/-100 it then move with the fib to T1 as well. I let the last trade run as far as it can, pulling the fib behind and the SL with it unless I see a nice T3 Target (skunny style).
Here is my question: You mentioned earlier closing 80% of your position. How do you technically do that? I mean can you close only a part of a trade or do you have to open for instance 10 distinct mini-lots with the same entry and different setting for TP and SL? Is there a way to open ten lots at once? I don’t see how to do that in MT4…
Thanks in advance.
Schmurex
Ignored
There are many peolpe trading very similar to what your doing, and placing thier fibs tagged to specific time frame of price and are very successful at it, so if thats your style continue to do so.
To close a portion of your trade in MT4 platform just select the trade you wish to close and before selecting the close trade button select the amount of the trade you want to close first, an instance would be if your trade is 1 full lot change the amount to 0.8 to close 80% the remaining 20 will continue to run. I forget what the maximum is for mini lots but if I rmember correctly its more than 10 mini lots.
 
 
  • Post #122
  • Quote
  • Mar 25, 2008 10:19pm Mar 25, 2008 10:19pm
  •  schmurex
  • Joined Jan 2007 | Status: Member | 122 Posts
Quoting Bobokus
Disliked
There are many peolpe trading very similar to what your doing, and placing thier fibs tagged to specific time frame of price and are very successful at it, so if thats your style continue to do so.
Ignored

Actually I was thinking it was your way to trade in your other thread...

Quoting Bobokus
Disliked
To close a portion of your trade in MT4 platform just select the trade you wish to close and before selecting the close trade button select the amount of the trade you want to close first, an instance would be if your trade is 1 full lot change the amount to 0.8 to close 80% the remaining 20 will continue to run. I forget what the maximum is for mini lots but if I rmember correctly its more than 10 mini lots.
Ignored

Thanks a lot, I didn't know that feature on MT4
It will make my life easyer
Schmurex


  • Post #123
  • Quote
  • Mar 25, 2008 10:32pm Mar 25, 2008 10:32pm
  •  Bobokus
  • | Commercial Member | Joined Oct 2006 | 2,560 Posts
Quoting schmurex
Disliked
Actually I was thinking it was your way to trade in your other thread...

Thanks a lot, I didn't know that feature on MT4
It will make my life easyer
Schmurex

Ignored
Me, I place my fibs on actual price movement instead of time basing them, I think I may have demonstated it in my other thread but i mentioned I dont trade them that way, just wanted to show both ways of using them.
 
 
  • Post #124
  • Quote
  • Mar 25, 2008 10:51pm Mar 25, 2008 10:51pm
  •  schmurex
  • Joined Jan 2007 | Status: Member | 122 Posts
Quoting Bobokus
Disliked
Me, I place my fibs on actual price movement instead of time basing them, I think I may have demonstated it in my other thread but i mentioned I dont trade them that way, just wanted to show both ways of using them.
Ignored
Excuse me to insist, please don't get me wrong, I'm not trying to argue just to get things clearer:
I might have not read the last few pages of your Fibbonacci thread but I remember the use of the intraday fib, with so many people asking if they should set their fibs to the high and low of the previous day or if they can consider a higher high or lower low outside of the limits of the previous day?
So do you mean that the intraday fib is not relevant in your technique?
Thanks
 
 
  • Post #125
  • Quote
  • Mar 25, 2008 10:56pm Mar 25, 2008 10:56pm
  •  Bobokus
  • | Commercial Member | Joined Oct 2006 | 2,560 Posts
Quoting schmurex
Disliked
Excuse me to insist, please don't get me wrong, I'm not trying to argue just to get things clearer:
I might have not read the last few pages of your Fibbonacci thread but I remember the use of the intraday fib, with so many people asking if they should set their fibs to the high and low of the previous day or if they can consider a higher high or lower low outside of the limits of the previous day?
So do you mean that the intraday fib is not relevant in your technique?
Thanks
Ignored
No you are right the Intraday can be considered tagged to price but there are more days than not that it will be pulled across more than just the high and low of the day. A for instance would be the past 2 days of cable the Intraday now would be across both days since there hasnt been any type of retracement yet. So I dont say that I would restrict it to the high and low of a 24 hour period it just works out that way alot of times.
 
 
  • Post #126
  • Quote
  • Mar 25, 2008 11:02pm Mar 25, 2008 11:02pm
  •  schmurex
  • Joined Jan 2007 | Status: Member | 122 Posts
Quoting Bobokus
Disliked
No you are right the Intraday can be considered tagged to price but there are more days than not that it will be pulled across more than just the high and low of the day. A for instance would be the past 2 days of cable the Intraday now would be across both days since there hasnt been any type of retracement yet. So I dont say that I would restrict it to the high and low of a 24 hour period it just works out that way alot of times.
Ignored
All clear now
Thanks
 
 
  • Post #127
  • Quote
  • Mar 26, 2008 3:30am Mar 26, 2008 3:30am
  •  walewhat
  • | Joined Feb 2008 | Status: Member | 31 Posts
hi bob,

good morning, my last question wasnt reply fully, am asking there that what exactly equity needed to trade the daily trend thanks hope to hear from u so soon
walewhat
honeyboy
 
 
  • Post #128
  • Quote
  • Edited at 5:51am Mar 26, 2008 5:49am | Edited at 5:51am
  •  ianf0ster
  • | Commercial Member | Joined Jan 2007 | 1,489 Posts
Quoting walewhat
Disliked
hi bob,

good morning, my last question wasnt reply fully, am asking there that what exactly equity needed to trade the daily trend thanks hope to hear from u so soon
walewhat
Ignored
Hi Walewhat,
I think that many of your questions (plus a lot more) are answered in the Forex Beginner Q&A forum here http://www.forexfactory.com/forumdisplay.php?f=56

Bo is not well and has little time to be answering all your questions.
Obviously, I am not Bo and would not consider myself an expert, but I will try to answer your question about equity as follows:

Most people (up to 95% of them) lose all or almost all of their first few Forex accounts. This is because they risk too high a percentage of their account on a single trade (or on several simultaneous trades in correlated currencies - e.g. E/U, G/U or E/J, G/J all 4 of which are largely driven by US$ strength or weakness). Thus it is generaly accepted that one should risk no more than 3% of an account on a single trade.
The daily Average True Range for G/U over the last 30 days is 162 pips - you then need to add some more to this to account for setting a stop loss a distance below the previous daily low - so let us say 170 pips.

So now we know that in order to trade the daily G/U , a 170pip loss must be no more than 3% of your account.
Obviously how much that is in terms of money will depend upon both you and your broker. If you have a micro account then that could be as little as $17 x 100/3. For a Mini account it would be $170 x 100/3 and for a full lot size account it would be $1700 x 100/3 approximately $57,000.

I hope that this helps,
Ian
 
 
  • Post #129
  • Quote
  • Mar 26, 2008 8:14am Mar 26, 2008 8:14am
  •  Bobokus
  • | Commercial Member | Joined Oct 2006 | 2,560 Posts
Update to the current trade, Finally some retrace in to his upmove will give us an idea of if the trade will be a good one or not by the way of the support levels(highlighted in Green). If they hold the trade should be OK. Where a Daily close below 1.9920 would be an early bad sign.
Price has already been rejected from the pivot point of the resistance levels as measured from the last push down in Cable indicating the downside pressure is still present.
Ideal situation is for price to rally or bounce from the Support levels and test 2.0065 a second time. Stoploss remains at 1.9852.
The Daily close today will be a key detirmining factor.
Attached Image (click to enlarge)
Click to Enlarge

Name: gbp0326.gif
Size: 31 KB
 
 
  • Post #130
  • Quote
  • Mar 26, 2008 8:27pm Mar 26, 2008 8:27pm
  •  Bobokus
  • | Commercial Member | Joined Oct 2006 | 2,560 Posts
Ive updated the stop loss now to the low of yesterday to 1.9920 locking in 56 pips and the trade sitting at +212 pips at the open of today. Still may see another bounce and reduce that some, I am going to hold this one in hopes of a run at 2.0143 next and we'll decide on the next move then or a failure to break long again tomorrow. I would like to see 2.0033 Downtrend Short fib level contain price on a dip which is also around todays Intraday long fib level at 2.0039 with the Intraday pivot level at 2.0017 a bounce from there and the trade is still in good standing, and like yesterday this will be our... "uuhO" level, to let us know price is turning against us.
Attached Image (click to enlarge)
Click to Enlarge

Name: daily0326.gif
Size: 31 KB
 
 
  • Post #131
  • Quote
  • Mar 27, 2008 12:59am Mar 27, 2008 12:59am
  •  Lou
  • Joined Mar 2004 | Status: Senior Member | 1,319 Posts
Quoting Bobokus
Disliked
Ive taken the break of Sunday's High and moved my stop loss to the low of today already since i wont be able to monitor this any and it will be a small loss if hit, currently price is only 50 or so pips from the entry so its very possible the stop can be hit on a retrace today, if not Ill be in a good position on a run to test resistance levels again. Resistance levels are 1.9990/2.0065/2.0143 as measured from this last move down in price on the Daily chart, also 2.0033 from the Downtrend fib will be in the mix.Ive updated the first post and posted the current chart here.
Ignored
Bo, I just want to be clear about this. You took the break of Sunday's high as you mention above to get into the trade. I don't see where there was a signal (based on the Daily Method ) to get into the trade there. It surely was a good call, but the entry was nowhere near crossing any line or zone at the time. The entry seems subjective compared to other 'rules' that help define this method. I do understand trading off of price action with an eye on the fundamentals, but I did not think it was a part of the Daily Method.

Honestly, I hope I missed something
 
 
  • Post #132
  • Quote
  • Mar 27, 2008 1:41am Mar 27, 2008 1:41am
  •  Bobokus
  • | Commercial Member | Joined Oct 2006 | 2,560 Posts
Quoting Lou
Disliked
Bo, I just want to be clear about this. You took the break of Sunday's high as you mention above to get into the trade. I don't see where there was a signal (based on the Daily Method ) to get into the trade there. It surely was a good call, but the entry was nowhere near crossing any line or zone at the time. The entry seems subjective compared to other 'rules' that help define this method. I do understand trading off of price action with an eye on the fundamentals, but I did not think it was a part of the Daily Method.

Honestly, I hope I missed something
Ignored
Your right, this week there really was no Sunday candle the high break is the high if the 21st, I didnt get a buy stop set when I opened up the platform on the 24, when I opened my platform up price had already surpased the high of 1.9861 and was moving back down on the 1 hour chart so I entered manully as close as possible to it. If I had set the buy stop it would have been set to 1.9869 but with the market already there I just entered manually since I didnt want to miss it. The difference is only 4 pips. Hope that clears up my reasoning for the entry, Its just when I was getting set up the market was already where I would have been looking for my entry to be.
 
 
  • Post #133
  • Quote
  • Mar 27, 2008 2:11am Mar 27, 2008 2:11am
  •  Lou
  • Joined Mar 2004 | Status: Senior Member | 1,319 Posts
Quoting Bobokus
Disliked
Your right, this week there really was no Sunday candle the high break is the high if the 21st, I didnt get a buy stop set when I opened up the platform on the 24, when I opened my platform up price had already surpased the high of 1.9861 and was moving back down on the 1 hour chart so I entered manully as close as possible to it. If I had set the buy stop it would have been set to 1.9869 but with the market already there I just entered manually since I didnt want to miss it. The difference is only 4 pips. Hope that clears up my reasoning for the entry, Its just when I was getting set up the market was already where I would have been looking for my entry to be.
Ignored
Yes, thanks Bo it clears things up. But it also begs the question of why your buy stop would have been set to 1.9869 ?
 
 
  • Post #134
  • Quote
  • Mar 27, 2008 2:23am Mar 27, 2008 2:23am
  •  Bobokus
  • | Commercial Member | Joined Oct 2006 | 2,560 Posts
Quoting Lou
Disliked
Yes, thanks Bo it clears things up. But it also begs the question of why your buy stop would have been set to 1.9869 ?
Ignored
My high of the 21st was 1.9861 +8pips, 1.9869
 
 
  • Post #135
  • Quote
  • Mar 27, 2008 8:46am Mar 27, 2008 8:46am
  •  Bobokus
  • | Commercial Member | Joined Oct 2006 | 2,560 Posts
It wont hurt to move up the stoploss already to todays low -5 pips (2.0028) since price is well over 100 pips above the low and lock in +164 pips now with the trade up around +275 pips as I write this but retracing some of todays move now.
Attached Image (click to enlarge)
Click to Enlarge

Name: 0327.gif
Size: 31 KB
 
 
  • Post #136
  • Quote
  • Mar 28, 2008 7:44pm Mar 28, 2008 7:44pm
  •  Bobokus
  • | Commercial Member | Joined Oct 2006 | 2,560 Posts
Well the Stop Loss is hit for +164 on the current retracement, Its a good thing we updated the stoploss to protect the profit. The Sell Stop is also picked up and we have stop and reversed and now Short at 2.0018 with the current stoploss set to Fridays high +8 (2.0096). Targeting the the Retracement fib levels (1.9860/1.9750) first, a break of those and I would re-evaluate the targets. if we can get some continuation in this movement to the downside we will get the opportunity to move up the stop again to protect profit and another possible reversal point.
Looking at the chart I see we are seeing a rejection from the Pivot of the last move down indicated by the Green area and fib levels. If this continues we are in a good position to ride this, the only thing I didnt like is the amount of support that was picked up late in the day and with it being a Friday, alot of the downside pressure today could have just been position squaring or profit taking and we could see a good bounce from the low now early in the upcoming week. Time will tell.
Attached Image (click to enlarge)
Click to Enlarge

Name: trade7.gif
Size: 30 KB
 
 
  • Post #137
  • Quote
  • Mar 30, 2008 12:46pm Mar 30, 2008 12:46pm
  •  Bobokus
  • | Commercial Member | Joined Oct 2006 | 2,560 Posts
In the current movement to aid in our next decisions we need to know where the Immediate (Shorter term) and Intermediate Support or (stronger support levels) are located. As well as the Immediate (Shorter term) and Intermediate Resistance (stronger resistance levels). Singling them out with nothing else on the chart can make things more clear sometimes.
First looking at the Immediate Support levels we can see they have been tested and all but the Short level broken so far, for this move to continue down a Daily close below 1.9908 is needed.
The Intermediate Support level which is the equivelant of our (Retracement fib) we can see price did not pick up support at the 1.9991 level and a Daily close below it now is a done deal. The next levels with slightly stronger Support levels now remaining are 1.9866/1.9741.
So from this we get our next support levels price.

1.9908
1.9880 (Fridays Low)
1.9866
1.9741
1.9733

Once price reaches each of these levels we watch to see if we get the Daily close below them as a continuation signal, or if they contain price by holding we know we have the chance to see a stalling or ranging and possibly a reversal and would look to adjust our trades stops accordingly. At the close of Friday we saw price pick up pretty good support and Spike up to 1.9998 ,I think was the last high but was imediately rejected so its a guessing game until more info is available from Sun/early Mondays movement.
Attached Images (click to enlarge)
Click to Enlarge

Name: dailysupport1.gif
Size: 22 KB Click to Enlarge

Name: dailysupport2.gif
Size: 22 KB
 
 
  • Post #138
  • Quote
  • Mar 30, 2008 1:05pm Mar 30, 2008 1:05pm
  •  Bobokus
  • | Commercial Member | Joined Oct 2006 | 2,560 Posts
Now we look at the Resistance levels if price rally's from its current level. Using the same approach we look for the Immediate Resistance levels and the Intermediate Resistance levels.
First the Immediate levels as measured from the previous push down in price we have a short signal by price breaking the Short level of this fib during Fridays movement. These levels are still present until we have reached the target of this fib or once price rally's another low point will be established and we can repull on the next downward move. This downward move is still active with no new low point yet established so we hold the fibs postions and its levels. This view gives us resistance levels of 1.9986/2.0065/2.0143.
Looking at the longer term view of Resistance the Intermadiate Resistance levels are the equivelant of our Downtrend Fib. From this weve seen price rally recently and break the 2.0248 level but could not be maintained above it, and has since broken the Short fib level of this Friday and withour the Long fib level of this ever being tested we know we can rely on the levels of this fib.
Our Resistance levels are now
1.9986
2.0033
2.0065
2.0088 (Fridays High)
2.0143
2.0248
On a rally of price we would look for the action or reaction of price to these levels as we would from the support levels. The never ending ping pong game of support and resistance.
Attached Images (click to enlarge)
Click to Enlarge

Name: dailyresistance1.gif
Size: 22 KB Click to Enlarge

Name: dailyresistance2.gif
Size: 21 KB
 
 
  • Post #139
  • Quote
  • Mar 31, 2008 11:04am Mar 31, 2008 11:04am
  •  USDSEK
  • | Joined May 2007 | Status: Member | 104 Posts
Hi Bobo,
I modified the system to fit my tradingstyle but so far I have had 3 successful trades and one loss.
I really like the simplicity of it .
There are no certainties only oppurtunities.
 
 
  • Post #140
  • Quote
  • Mar 31, 2008 12:03pm Mar 31, 2008 12:03pm
  •  Bobokus
  • | Commercial Member | Joined Oct 2006 | 2,560 Posts
Quoting USDSEK
Disliked
Hi Bobo,
I modified the system to fit my tradingstyle but so far I have had 3 successful trades and one loss.
I really like the simplicity of it .
Ignored
Great job then !! Just keep doing what your doing.
 
 
  • Trading Systems
  • /
  • Trading the Daily
  • Reply to Thread
    • 1 56Page 789 15
    • 1 6Page 78 15
0 traders viewing now
  • More
Top of Page
  • Facebook
  • Twitter
About FF
  • Mission
  • Products
  • User Guide
  • Media Kit
  • Blog
  • Contact
FF Products
  • Forums
  • Trades
  • Calendar
  • News
  • Market
  • Brokers
  • Trade Explorer
FF Website
  • Homepage
  • Search
  • Members
  • Report a Bug
Follow FF
  • Facebook
  • Twitter

FF Sister Sites:

  • Metals Mine
  • Energy EXCH
  • Crypto Craft

Forex Factory® is a brand of Fair Economy, Inc.

Terms of Service / ©2022