>>>> UPDATE - sorry this one's off to the recycle bin. It's become way too valuable to dole out here. But I'll leave the posts so you can get the idea and code similar >>>
This is badass.
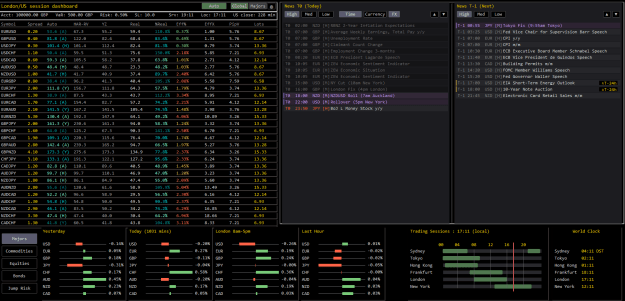
It's a fully-featured panel for the fastest read across the currency universe I could imagine and robust predictive volatility modelling. Based on this thread here (https://www.forexfactory.com/thread/post/15461331#post15461331) and an original panel by MoodyBot.
Change log:
03/03: unpublished changes
2_9_4: Regime detection a/c to curves
This was the first run of wiring everything together, and it's good but needs work. The regime detection was very basic just to prove principle, but it surfaced the stats of the curves and revealed hidden structures that we can improve on. The good news is curves work very well across majors. Across crosses - the basic curves work but event based ones are useless. Not degrading quality, but just useless. It's enough to work on though. So now, we freeze the curves as is and move on.
2_9_3: Consumption curves 1/3
Curve families created for news categories. Daily templates for each pair and historical created with construction curves shown on stats page, hourlies on majors. Uses kernel on event time (macro) or session (CB events) normalised to produce hourly weightings. Written to CSVs for later use.
2_9_2_2: Events 1/3 d/l, categorised and uplifts created per pair - unpublished
Uplifts created per pair, wired into stats. Couple of % performance increase but large jump in robustness due to dispensing with global uplift variables. Stats surfaced on global page, majors and its own news stats page.
2_9_1: UI changes 21/2 currently using dummy data - unpublished
Global page:
- click to chart across all pairs loading default template (BK_HAR.tpl). If not installed will use default template.
- YZ/HAR colums replaced with one column showing values in use, now defaulting to HAR not Auto
- Addition of uplift column showing future impact of events on HAR
Majors page:
- Uplift figure and click to chart added to all panels with heatmap colours.
- New mode toggle added cycles between News - the current default, Cats (categories) and Hourlies. Cats disuplays the category and label for today/tomorrow and construction method for consumption curves. Hourlies displays hour by hour forecast of vol
Stats page:
- Two new modes cycles between HAR stats, News stats and Curves
- News stats shows summary of all downloads, detail on today and previous 20 days categorisation of day and construction method.
- Curves shows curve templates of all pairs across session and categories of events
Fixes:
Click FX in Majors was doing nothing, not sure when this happened. Fixed.
Click to collapse removed from Stats.
2_8 19/2 Timezone shift (unpublished)
Shifted start time from London midnight (the easiest and most popular) to London fix at 4pm. Option implied vols update at 4pm, regimes literally reclibrate at this time. Negligible performance increases (around 1.5%), but 40% drop in RMSE (root mean squared error - ie the big oversized days are not as bad) The downside - statistically less robust DM test against YZ & ATR. However, end result is telling - on balance now the HAR is about 30% better on majors than YZ and ATR, 20% on crosses, 22% overall. This is pretty much bang on what I'd hoped for.
2_7 11/2 Base improvements (unpublished)
- Refactored unified cache
- 3-step init screen (data/calcs/continue) now with default two year history, retry and sensible single broker requests for data not already cached in user history. Let it sit on first run, else you'll swamp broker with unnecessary data requests. If any fail, retry. Once done, click calculate, then skip or continue. Skip skips failures.
- Detailed stats screen, with detailed stats per pair, full graphs (click pair/forecast) of last 20 days historical performance and DM test to show superiority against YZ and ATR models
- Refactored HAR uisng seasonality and fitting to convert RV to range now calculating against every pair individually as opposed to deriving from crosses (historically). Improves baseline performance and crosses.
2_6 cancelled - refactor of the HAR went in disastrously wrong direction
12/11: Update: 2_5
- Massive data restructure and better predictive performance. Also merged thread so appreciate feedback but it's gone
FEATURES LIST - 2_4
Features (initialisation):
- Detailed pre-initialisation screen with data-fetching, symbol validation and pre-calculations of vol models and jump risk
Features (global view):
- Volatility prediction using HAR-RV model with 6 months lookback @5m resolution, walk-forward optimisation with 3 months out of sample. Crosses derived from majors for HAR. Not for YZ in case there's a problem with one of majors history.
- Incorporated back history of HAR-RV, Yang Zhang and ATR accuracy rates (past 20 valid trading days)
- Auto mode that switches between most accurate based on rolling MAE comparison over 20 days.
- Dynamic efficiency ratios of cost of trade made using spread:forecast
- Strength meters using normalised Bloomberg DXY ratings across commodities, equities, bonds and currencies with session lookback. In layman's terms, these are accurate. Most are not.
- Jump risk stats of 10 biggest moves (high-low) over 1 minute over past 30 days across majors with chart click-through for each
- DST aware visual sessions and world clock
- Pip calculator with risk/SL updated dynamically
- News now and next. Flags for news exactly +/- 1440 minutes with user config buffer. Additional optional FX events of cut/roll/fix.
Features (majors view):
- Majors view with visual representation of range prediction vs realised using Auto, HAR or YZ
- News aggregated by pair with now/next and optional fix/roll/cut and timer to next high impact
- Volatility switch between Auto and HAR/YZ
ROADMAP updated 3/3
2_91 UI changes. As dash is used as a debug surface too, I'll prioritise UI changes for events, curves and hourlies using dummy data
2_92 Event download, processing, categorisation and display. Creation, application and display of HAR uplifts. Check performance stats.
2_93 Consumption curves, template creations, mapping to events, creation of curves today and 20 day historical, and display
2_94 Curve stats and regime detection module to validate both before using in production.
2_95 Regime detection 2.0. Improve granularity of regimes. Surface stats. Live modify forecasts based on regime change.
2_96 Baseline dash changes: switch on caching, test, write outputs to CSVs, test indicator can pick up. Final UI changes likely to majors page to make live stats more accessible
3_0 Full release
+
Indicator 1_0 Creation of indicator to display hourlies, speedometer, regime detection, plus jump to tail risk events
GEEK NOTES 23/2
HAR-RV outperforms Garch in FX, and if well calibrated, even outperforming ATM IVs too (except in high vol events). All majors and crosses are now calculated directly off the data with no derived calculations (from version 2_7 onwards). HAR contains jump parameters, seasonality, walk-forward optimisation with 6 months out of sample.
Auto mode in the panel to switch between modes was there during construction as HAR was behaving erratically. Now it's stable, advise to keep it to HAR at all times.
Model from 2_7 onwards works London fix - London fix. This is the optimal time for vol models given it aligns with real money movements (discovered, not widely used by academics).
- Currency strength use BBDXY %s, normalised across 7 currencies. They'll need to be updated annually ofc, but better than DXY weights.
USE:
1) You'll need a live account with a broker that provides data for the equities, bonds, and commods data to work. It'll work with a demo account but some symbols won't be available. However even MT5 server demo accounts have the majors, crosses, gold and silver and delayed data on equities.
2) You need to subscribe to all the symbols below. If you've a broker where they've renamed them all you'll have to enter a gazillion pair names. No way around this. The symbols are changeable in the settings if your broker has different.
3) You can adjust the local time via settings but I've never tried it outside of UK. Hopefully works
4) Timezones and DST. Spent an eternity on this; it should keep up with clock changes at all times, all locations.
5) Set your chart to black, save as template.
6) The init screen will tell you the state of your MT5 data. Choose to reload or skip if you're in a hurry. Big calcs cache so it'll be fast after the first run.
SYMBOLS:
All majors + crosses
Commodities:
Gold: XAUUSD
Silver: XAGUSD
Brent: BNO
WTI : USO
Nat gas: UNG
Equities
S&P: SP 500m
FTSE: FTSE100
Euro: EUSTX50
Nikkei: JPN225
Hang Seng: HK50.
Bonds and credit
1-3yr: SHY
7-10yr: IEF
20+yr: TLT
US H/yld: HYG
US invest: LQD
NB Stats page screenshot from unpublished version
This is badass.
It's a fully-featured panel for the fastest read across the currency universe I could imagine and robust predictive volatility modelling. Based on this thread here (https://www.forexfactory.com/thread/post/15461331#post15461331) and an original panel by MoodyBot.
Change log:
03/03: unpublished changes
2_9_4: Regime detection a/c to curves
This was the first run of wiring everything together, and it's good but needs work. The regime detection was very basic just to prove principle, but it surfaced the stats of the curves and revealed hidden structures that we can improve on. The good news is curves work very well across majors. Across crosses - the basic curves work but event based ones are useless. Not degrading quality, but just useless. It's enough to work on though. So now, we freeze the curves as is and move on.
2_9_3: Consumption curves 1/3
Curve families created for news categories. Daily templates for each pair and historical created with construction curves shown on stats page, hourlies on majors. Uses kernel on event time (macro) or session (CB events) normalised to produce hourly weightings. Written to CSVs for later use.
2_9_2_2: Events 1/3 d/l, categorised and uplifts created per pair - unpublished
Uplifts created per pair, wired into stats. Couple of % performance increase but large jump in robustness due to dispensing with global uplift variables. Stats surfaced on global page, majors and its own news stats page.
2_9_1: UI changes 21/2 currently using dummy data - unpublished
Global page:
- click to chart across all pairs loading default template (BK_HAR.tpl). If not installed will use default template.
- YZ/HAR colums replaced with one column showing values in use, now defaulting to HAR not Auto
- Addition of uplift column showing future impact of events on HAR
Majors page:
- Uplift figure and click to chart added to all panels with heatmap colours.
- New mode toggle added cycles between News - the current default, Cats (categories) and Hourlies. Cats disuplays the category and label for today/tomorrow and construction method for consumption curves. Hourlies displays hour by hour forecast of vol
Stats page:
- Two new modes cycles between HAR stats, News stats and Curves
- News stats shows summary of all downloads, detail on today and previous 20 days categorisation of day and construction method.
- Curves shows curve templates of all pairs across session and categories of events
Fixes:
Click FX in Majors was doing nothing, not sure when this happened. Fixed.
Click to collapse removed from Stats.
2_8 19/2 Timezone shift (unpublished)
Shifted start time from London midnight (the easiest and most popular) to London fix at 4pm. Option implied vols update at 4pm, regimes literally reclibrate at this time. Negligible performance increases (around 1.5%), but 40% drop in RMSE (root mean squared error - ie the big oversized days are not as bad) The downside - statistically less robust DM test against YZ & ATR. However, end result is telling - on balance now the HAR is about 30% better on majors than YZ and ATR, 20% on crosses, 22% overall. This is pretty much bang on what I'd hoped for.
2_7 11/2 Base improvements (unpublished)
- Refactored unified cache
- 3-step init screen (data/calcs/continue) now with default two year history, retry and sensible single broker requests for data not already cached in user history. Let it sit on first run, else you'll swamp broker with unnecessary data requests. If any fail, retry. Once done, click calculate, then skip or continue. Skip skips failures.
- Detailed stats screen, with detailed stats per pair, full graphs (click pair/forecast) of last 20 days historical performance and DM test to show superiority against YZ and ATR models
- Refactored HAR uisng seasonality and fitting to convert RV to range now calculating against every pair individually as opposed to deriving from crosses (historically). Improves baseline performance and crosses.
2_6 cancelled - refactor of the HAR went in disastrously wrong direction
12/11: Update: 2_5
- Massive data restructure and better predictive performance. Also merged thread so appreciate feedback but it's gone
FEATURES LIST - 2_4
Features (initialisation):
- Detailed pre-initialisation screen with data-fetching, symbol validation and pre-calculations of vol models and jump risk
Features (global view):
- Volatility prediction using HAR-RV model with 6 months lookback @5m resolution, walk-forward optimisation with 3 months out of sample. Crosses derived from majors for HAR. Not for YZ in case there's a problem with one of majors history.
- Incorporated back history of HAR-RV, Yang Zhang and ATR accuracy rates (past 20 valid trading days)
- Auto mode that switches between most accurate based on rolling MAE comparison over 20 days.
- Dynamic efficiency ratios of cost of trade made using spread:forecast
- Strength meters using normalised Bloomberg DXY ratings across commodities, equities, bonds and currencies with session lookback. In layman's terms, these are accurate. Most are not.
- Jump risk stats of 10 biggest moves (high-low) over 1 minute over past 30 days across majors with chart click-through for each
- DST aware visual sessions and world clock
- Pip calculator with risk/SL updated dynamically
- News now and next. Flags for news exactly +/- 1440 minutes with user config buffer. Additional optional FX events of cut/roll/fix.
Features (majors view):
- Majors view with visual representation of range prediction vs realised using Auto, HAR or YZ
- News aggregated by pair with now/next and optional fix/roll/cut and timer to next high impact
- Volatility switch between Auto and HAR/YZ
ROADMAP updated 3/3
2_91 UI changes. As dash is used as a debug surface too, I'll prioritise UI changes for events, curves and hourlies using dummy data
2_92 Event download, processing, categorisation and display. Creation, application and display of HAR uplifts. Check performance stats.
2_93 Consumption curves, template creations, mapping to events, creation of curves today and 20 day historical, and display
2_94 Curve stats and regime detection module to validate both before using in production.
2_95 Regime detection 2.0. Improve granularity of regimes. Surface stats. Live modify forecasts based on regime change.
2_96 Baseline dash changes: switch on caching, test, write outputs to CSVs, test indicator can pick up. Final UI changes likely to majors page to make live stats more accessible
3_0 Full release
+
Indicator 1_0 Creation of indicator to display hourlies, speedometer, regime detection, plus jump to tail risk events
GEEK NOTES 23/2
HAR-RV outperforms Garch in FX, and if well calibrated, even outperforming ATM IVs too (except in high vol events). All majors and crosses are now calculated directly off the data with no derived calculations (from version 2_7 onwards). HAR contains jump parameters, seasonality, walk-forward optimisation with 6 months out of sample.
Auto mode in the panel to switch between modes was there during construction as HAR was behaving erratically. Now it's stable, advise to keep it to HAR at all times.
Model from 2_7 onwards works London fix - London fix. This is the optimal time for vol models given it aligns with real money movements (discovered, not widely used by academics).
- Currency strength use BBDXY %s, normalised across 7 currencies. They'll need to be updated annually ofc, but better than DXY weights.
USE:
1) You'll need a live account with a broker that provides data for the equities, bonds, and commods data to work. It'll work with a demo account but some symbols won't be available. However even MT5 server demo accounts have the majors, crosses, gold and silver and delayed data on equities.
2) You need to subscribe to all the symbols below. If you've a broker where they've renamed them all you'll have to enter a gazillion pair names. No way around this. The symbols are changeable in the settings if your broker has different.
3) You can adjust the local time via settings but I've never tried it outside of UK. Hopefully works
4) Timezones and DST. Spent an eternity on this; it should keep up with clock changes at all times, all locations.
5) Set your chart to black, save as template.
6) The init screen will tell you the state of your MT5 data. Choose to reload or skip if you're in a hurry. Big calcs cache so it'll be fast after the first run.
SYMBOLS:
All majors + crosses
Commodities:
Gold: XAUUSD
Silver: XAGUSD
Brent: BNO
WTI : USO
Nat gas: UNG
Equities
S&P: SP 500m
FTSE: FTSE100
Euro: EUSTX50
Nikkei: JPN225
Hang Seng: HK50.
Bonds and credit
1-3yr: SHY
7-10yr: IEF
20+yr: TLT
US H/yld: HYG
US invest: LQD
NB Stats page screenshot from unpublished version
Attached Image(s) (click to enlarge)