combining levels with value. github commit 4d28d770523c925622a789f13eda8700852bec18
Attached Image (click to enlarge)

Struggling Russians Turn to Day-Trading to Pay the Bills 21 replies
Canadian T-bills question 2 replies
National Debt, T Bills, Bonds 0 replies
//+------------------------------------------------------------------+
//| ExportRectanglesToJSON_v7.mq5 |
//| Copyright 2025, Your Name or Organization |
//| https://www.example.com |
//+------------------------------------------------------------------+
#property copyright "Your Name or Organization"
#property link "https://www.example.com"
#property version "7.00"
// Include necessary libraries
#include <Files/File.mqh>
// Global variables
long lastChartID = 0; // Track chart ID
string FileName;
//+------------------------------------------------------------------+
//| Expert initialization function |
//+------------------------------------------------------------------+
int OnInit()
{
// Set file name based on chart symbol
FileName = Symbol() + ".csv";
lastChartID = ChartID();
Print("EA initialized. Monitoring rectangles on chart ID: ", lastChartID, ", File: ", FileName);
return(INIT_SUCCEEDED);
}
//+------------------------------------------------------------------+
//| Expert deinitialization function |
//+------------------------------------------------------------------+
void OnDeinit(const int reason)
{
Print("EA deinitialized. Reason: ", reason);
}
//+------------------------------------------------------------------+
//| Function to determine rectangle type based on price history |
//+------------------------------------------------------------------+
string DetermineRectangleType(double top, double bottom, datetime referenceTime, bool isHistorical)
{
string rectType = "";
double prevCloses[];
ArraySetAsSeries(prevCloses, true);
int maxCandles = 25;
int copied = 0;
if(isHistorical)
{
copied = CopyClose(Symbol(), Period(), referenceTime, maxCandles, prevCloses);
if(copied <= 0)
{
Print("Error copying historical close prices: ", GetLastError());
return rectType;
}
}
else
{
copied = CopyClose(Symbol(), Period(), 0, maxCandles, prevCloses);
if(copied <= 0)
{
Print("Error copying close prices: ", GetLastError());
return rectType;
}
}
for(int i = 0; i < copied; i++)
{
if(prevCloses[i] < bottom)
{
rectType = "supply";
break;
}
else if(prevCloses[i] > top)
{
rectType = "demand";
break;
}
}
return rectType;
}
//+------------------------------------------------------------------+
//| Function to set rectangle properties |
//+------------------------------------------------------------------+
// iterate backwards from x1 to find the first close outside the zone
void SetRectangleProperties(string objName)
{
string existingType = ObjectGetString(lastChartID, objName, OBJPROP_TEXT);
if(existingType == "supply" || existingType == "demand")
return;
double y1 = ObjectGetDouble(lastChartID, objName, OBJPROP_PRICE, 0);
double y2 = ObjectGetDouble(lastChartID, objName, OBJPROP_PRICE, 1);
datetime x1 = (datetime)ObjectGetInteger(lastChartID, objName, OBJPROP_TIME, 0);
double top = MathMax(y1, y2);
double bottom = MathMin(y1, y2);
string rectType = "";
datetime currentTime = TimeCurrent();
if(currentTime > x1)
{
rectType = DetermineRectangleType(top, bottom, x1, true);
}
else
{
double currentPrice = SymbolInfoDouble(Symbol(), SYMBOL_BID);
if(currentPrice < bottom)
rectType = "supply";
else if(currentPrice > top)
rectType = "demand";
else
rectType = DetermineRectangleType(top, bottom, 0, false);
}
if(rectType != "")
{
ObjectSetString(lastChartID, objName, OBJPROP_TEXT, rectType);
color rectColor = rectType == "demand" ? clrCornflowerBlue : rectType == "supply" ? clrSalmon : clrBlack;
ObjectSetInteger(lastChartID, objName, OBJPROP_COLOR, rectColor);
ObjectSetInteger(lastChartID, objName, OBJPROP_FILL, true);
ObjectSetInteger(lastChartID, objName, OBJPROP_BACK, true);
}
else
{
Print("Could not determine type for rectangle ", objName);
}
}
//+------------------------------------------------------------------+
//| Function to export rectangles to CSV file |
//+------------------------------------------------------------------+
void ExportRectanglesToCSV()
{
// Get current price
double currentPrice = SymbolInfoDouble(Symbol(), SYMBOL_BID);
// Get all rectangle objects
int totalObjects = ObjectsTotal(lastChartID, 0, OBJ_RECTANGLE);
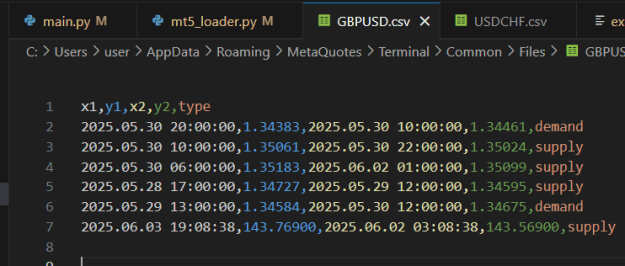
string csv = "x1,y1,x2,y2,type\n"; // CSV header
for(int i = 0; i < totalObjects; i++)
{
string objName = ObjectName(lastChartID, i, 0, OBJ_RECTANGLE);
if(objName == "")
{
Print("Warning: Empty object name at index ", i);
continue;
}
// Get rectangle properties
datetime x1 = (datetime)ObjectGetInteger(lastChartID, objName, OBJPROP_TIME, 1);
datetime x2 = (datetime)ObjectGetInteger(lastChartID, objName, OBJPROP_TIME, 0);
double y1 = ObjectGetDouble(lastChartID, objName, OBJPROP_PRICE, 0);
double y2 = ObjectGetDouble(lastChartID, objName, OBJPROP_PRICE, 1);
// Check for errors in property retrieval
if(GetLastError() != 0)
{
Print("Error retrieving properties for object ", objName, ": ", GetLastError());
continue;
}
// Set rectangle properties (only sets type if not already set)
SetRectangleProperties(objName);
// Get rectangle type
string rectType = ObjectGetString(lastChartID, objName, OBJPROP_TEXT);
if(rectType == "") rectType = "Unknown"; // Fallback if type not set
// Format rectangle data
string rectData = StringFormat(
"%s,%.5f,%s,%.5f,%s",
TimeToString(x1, TIME_DATE|TIME_MINUTES|TIME_SECONDS),
y1,
TimeToString(x2, TIME_DATE|TIME_MINUTES|TIME_SECONDS),
y2,
rectType
);
// Add to CSV
csv += rectData + "\n";
}
// Write to file
int fileHandle = FileOpen(FileName, FILE_WRITE|FILE_TXT|FILE_COMMON);
if(fileHandle == INVALID_HANDLE)
{
Print("Error opening file ", FileName, ": ", GetLastError());
return;
}
FileWrite(fileHandle, csv);
FileClose(fileHandle);
Print("Exported ", totalObjects, " rectangles to ", FileName, " at ", TimeToString(TimeCurrent(), TIME_DATE|TIME_MINUTES|TIME_SECONDS));
}
//+------------------------------------------------------------------+
//| Chart event handler |
//+------------------------------------------------------------------+
void OnChartEvent(const int id,
const long &lparam,
const double &dparam,
const string &sparam)
{
// Log all chart events for debugging
//Print("Chart event received: ID=", id, ", Object=", sparam, ", Time=", TimeToString(TimeCurrent(), TIME_DATE|TIME_MINUTES|TIME_SECONDS));
if(id == 2) // CHARTEVENT_OBJECT_CHANGE
{
// Get object type
long objType = -1;
if(ObjectFind(lastChartID, sparam) >= 0)
{
objType = ObjectGetInteger(lastChartID, sparam, OBJPROP_TYPE);
if(GetLastError() != 0)
{
Print("Error getting object type for ", sparam, ": ", GetLastError());
return;
}
}
else
{
Print("Object ", sparam, " not found on chart ID ", lastChartID);
return;
}
//Print("Object ", sparam, " type: ", objType, " (OBJ_RECTANGLE=", OBJ_RECTANGLE, ")");
if(objType == OBJ_RECTANGLE)
{
//Print("Rectangle event detected: ", sparam, " (", id == CHARTEVENT_OBJECT_CREATE ? "Created" : "Changed", ") at ", TimeToString(TimeCurrent(), TIME_DATE|TIME_MINUTES|TIME_SECONDS));
ExportRectanglesToCSV();
}
else
{
Print("Non-rectangle object ignored: ", sparam, ", Type=", objType);
}
}
}
//+------------------------------------------------------------------+ EURx Formula: EURUSD*0.1418+EURGBP*0.6165+EURJPY*0.0022+EURAUD*0.0906+EURCAD*0.1489 USDx Formula: EURUSD*-0.1986+GBPUSD*-0.2022+USDJPY*0.0015+USDCAD*0.2354+AUDUSD*-0.3623 GBPx Formula: GBPUSD*0.1417+GBPJPY*0.0017+EURGBP*-0.6053+GBPAUD*0.0917+GBPCAD*0.1596 JPYx Formula: USDJPY*-0.1227+EURJPY*-0.252+GBPJPY*-0.1946+AUDJPY*-0.188+CADJPY*-0.2428 AUDx Formula: AUDUSD*0.3177+AUDJPY*0.002+EURAUD*-0.1112+GBPAUD*-0.1148+AUDCAD*0.4543 CADx Formula: USDCAD*-0.1974+EURCAD*-0.1749+CADJPY*0.0025+AUDCAD*-0.4344+GBPCAD*-0.1909