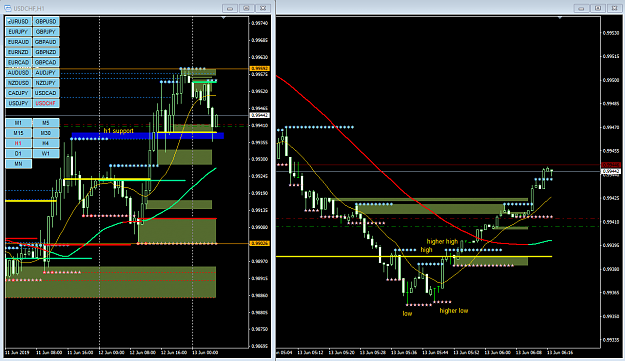
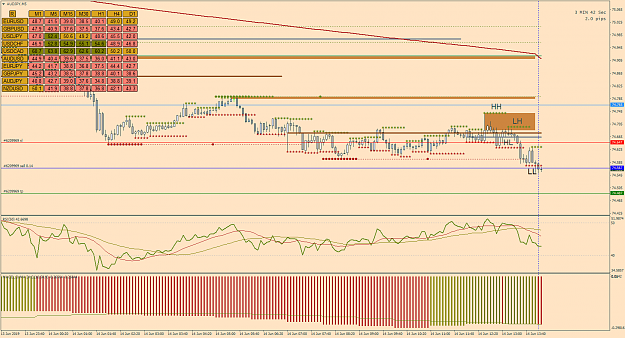
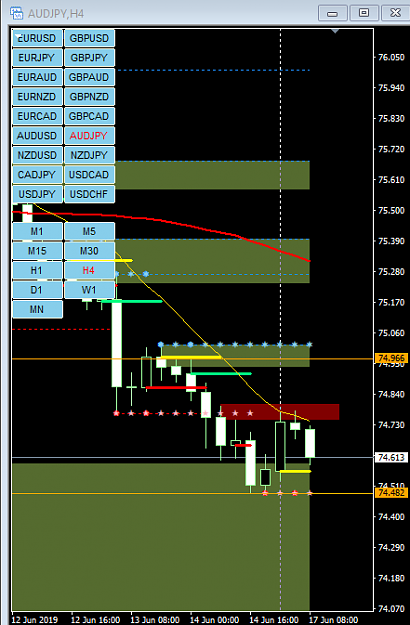
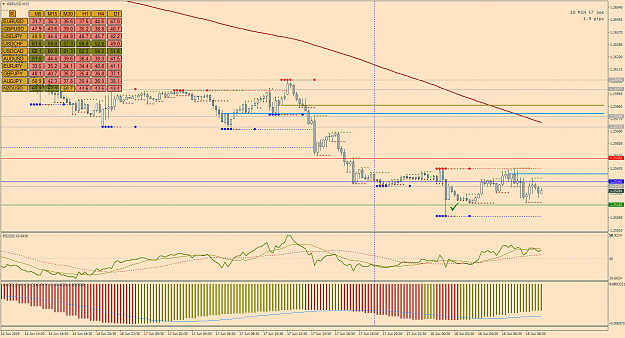
I used the Higher High/Lower High, Higher Low/Lower Low as my set-up and the break of the Lower Low as my trigger. I didn't see any resistance below to worry about. All the other indicators are in support...
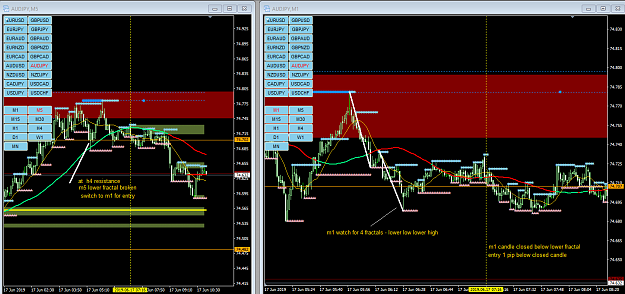
Using the USDCHF chart, it could be traded the following way. Say when price is approaching the H1 resistance, or the day open/london open/new york open (or at the previous session level), previous day high low, look for 4 fractals. in this illustration, one low one lower low (previous low broken) and one high one lower high. then look for things like 3 brp, candle close below 50 SMA, fractals, session open lines. place a pending sale 1 pip below the closed candle. *always remember to count the number of waves and wait for pullback. 3/4 waves down,...
Ignored
It took me a while to figure out what you're doing here but it finally makes sense.
You are catching the trend on the second wave - brilliant!
I will try to put this to good use!
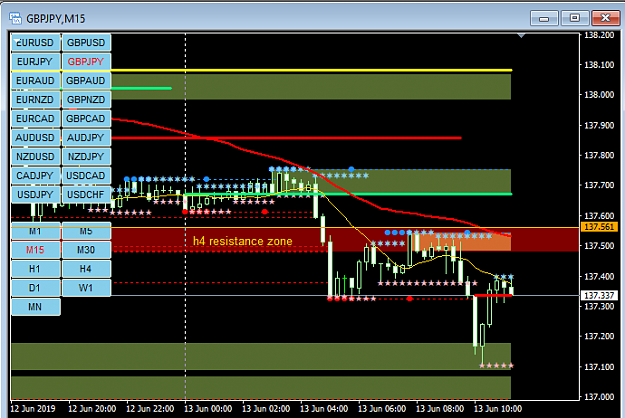
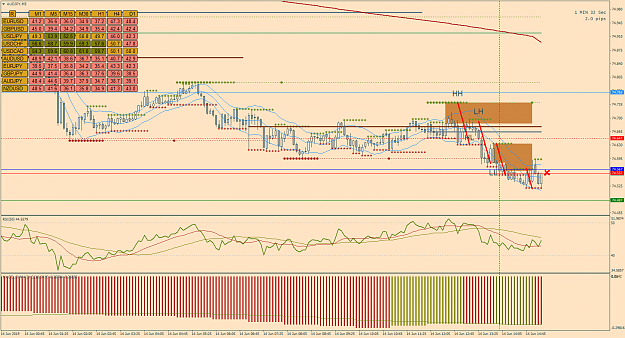
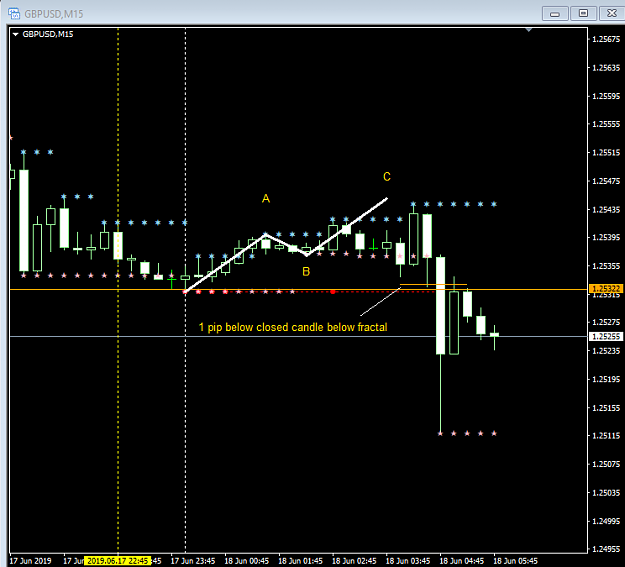
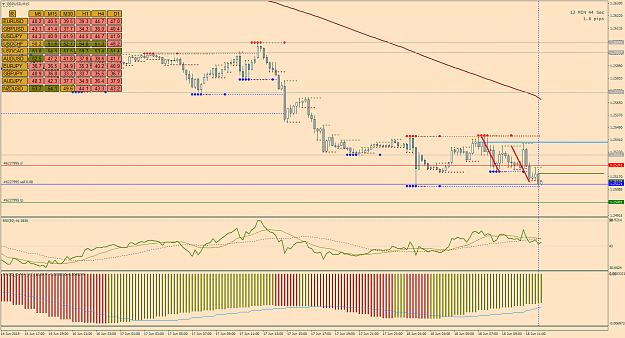
When I saw that the fifth high was higher than the fourth high I realized that the trend was weakening. I waited for price to drop below my entry and then set my S/L to one pip profit.
When I saw that the fifth high was higher than the fourth high I realized that the trend was weakening. I waited for price to drop below my entry and then set my S/L to one pip profit. {image}
Ignored
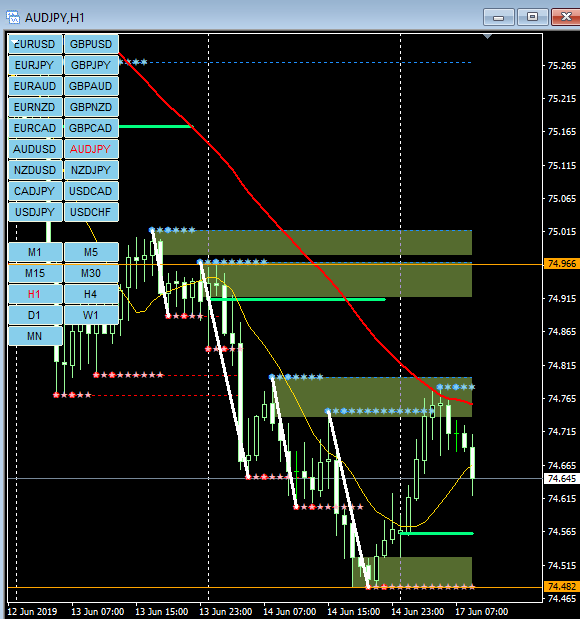
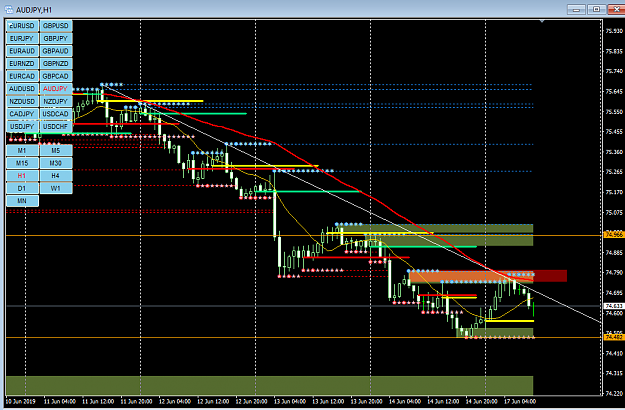
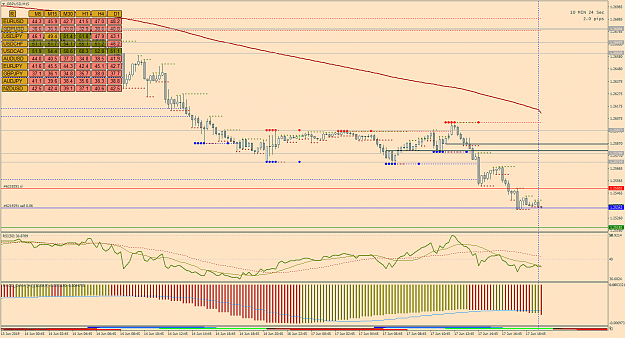
take a closer look at h1 on your sell
it's already on the 4th down wave.
another thing to note for the day is when asia is down and london is down, more likely to consolidate or pullback at new york, unless ny news help trend continuation.
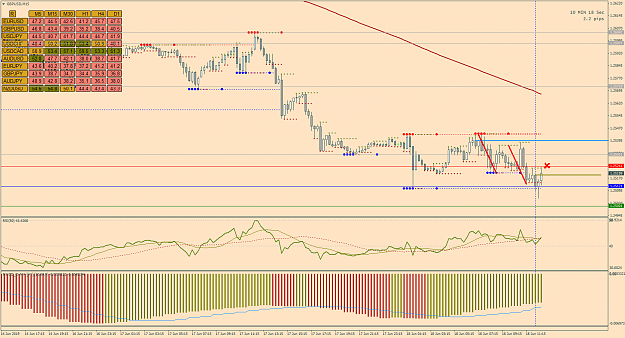
When I saw that the fifth high was higher than the fourth high I realized that the trend was weakening. I waited for price to drop below my entry and then set my S/L to one pip profit. {image}
Ignored
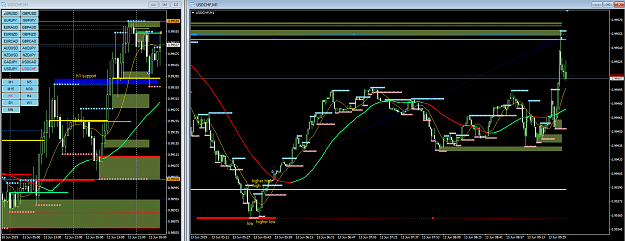
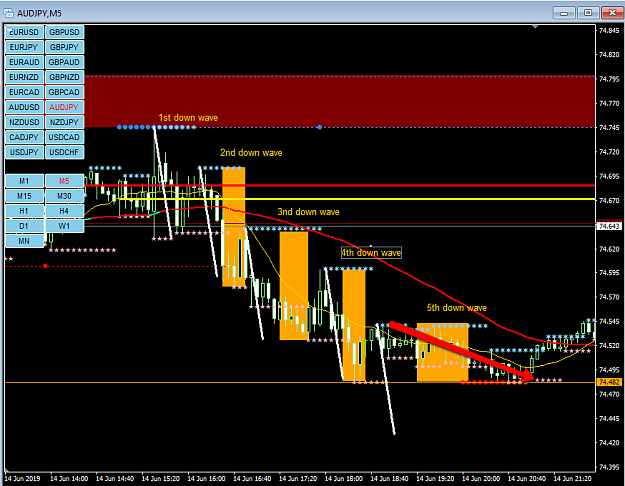
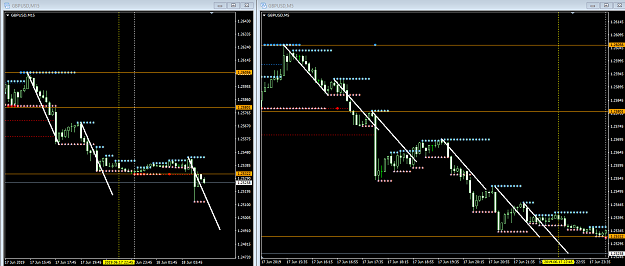
talking about the weakening of trend in m5.
copying the angle and amplitude of 1st white down wave for comparion.
the 2nd down wave exceeded the amplitude of the 1st with about the same angle -> expect the next down wave to go a distance.
3rd and 4th down down waves about the same amplitude as the 1st down wave but 3rd wave with angle weakening.
5th down wave coming short on both amplitude and angle of 1st down wave.
then the reversal.
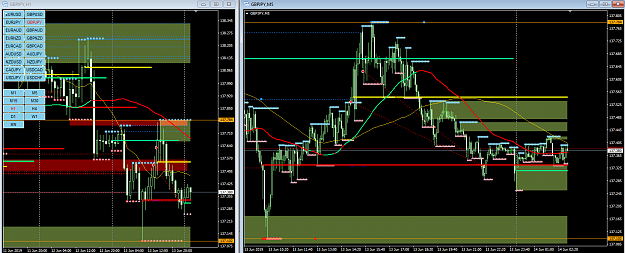
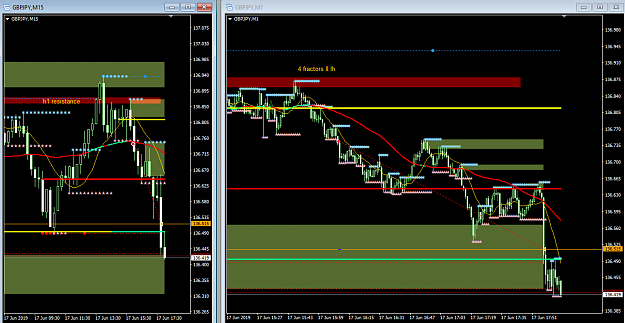
Lower highs and lower lows after a breakout. And no resistance in sight. {image}
Ignored
the problem is entry was at the tail end of momentum. do not force trade.
again wave counting to gauge momentum.
m15 - 2nd down wave fall short of 1st.
m5 - 5th down wave fall short of 1st. you entered on the 6th wave when going into consolidation.
if you really want to enter trade on losing momentum, at least wait for 2 up waves ABC retracement in the m15 (just saying, in this case is not a good example as it was at previous day's low).