• Home
  • Forums
  • Trades
  • News
  • Calendar
  • Market
  • Brokers
  • Login
  • Join
  • User/Email: Password:
  • 8:48am
Menu
  • Forums
  • Trades
  • News
  • Calendar
  • Market
  • Brokers
  • Login
  • Join
  • 8:48am
Sister Sites
  • Metals Mine
  • Energy EXCH
  • Crypto Craft

Options

Bookmark Thread

First Page First Unread Last Page Last Post

Printable Version

  • Trading Journals
  • /
  • Reply to Thread
  • Subscribe
  • 2
Attachments: Partum Pecunia Influunt
Exit Attachments

Partum Pecunia Influunt

  • Post #1
  • Quote
  • First Post: Edited Mar 5, 2019 10:58pm Feb 27, 2019 2:21pm | Edited Mar 5, 2019 10:58pm
  •  TEntropy
  • | Joined Dec 2018 | Status: Member | 51 Posts
System Parts (In Order of Importance):
1. Money Management Strategy
2. Risk:Reward Optimization
3. Entry/Exit Strategy

Benchmark:
- Average S&P500 Annual Returns (9.8%)
  • Post #2
  • Quote
  • Feb 28, 2019 8:09pm Feb 28, 2019 8:09pm
  •  TEntropy
  • | Joined Dec 2018 | Status: Member | 51 Posts
A Note About the Benchmark:

From 2017 U.S. Year End Report:
"There is nothing novel about the index versus active debate. It has been a contentious subject for decades, and there are few strong believers on both sides, with the vast majority of market participants falling somewhere in between. Since its first publication 16 years ago, the SPIVA Scorecard has served as the de facto scorekeeper of the active versus passive debate. For more than a decade, we have heard passionate arguments from believers in both camps when headline numbers have deviated from their beliefs.

During the one-year period, the percentage of managers outperforming their respective benchmarks noticeably increased in categories like Mid-Cap Growth and Small-Cap Growth Funds, compared to results from six months prior. Over the one-year period, 63.08% of large-cap managers, 44.41% of mid-cap managers, and 47.70% of small-cap managers underperformed the S&P 500, the S&P MidCap 400, and the S&P SmallCap 600, respectively (see table above).
While results over the short term were favorable, the majority of active equity funds underperformed over the longer-term investment horizons. Over the five-year period, 84.23% of large-cap managers, 85.06% of mid-cap managers, and 91.17% of small-cap managers lagged their respective benchmarks (see table).
Similarly, over the 15-year investment horizon, 92.33% of large-cap managers, 94.81% of mid-cap managers, and 95.73% of small-cap managers failed to outperform on a relative basis (see red highlight in table)."

Many who stumble on this thread will probably see that benchmark and thing that is a pretty low goal to strive for, but the fact of the matter is, over time, 90-95% of people will not be able to match this. And if you can consistently beat this benchmark, it doesn't matter how big your account is because you will be able to comfortably find yourself in one of two positions:
1. Investors will be head over heels to throw money at you.
2. Banks/Investment Firms will be chomping at the bit to hire you.

This game is a long a play, not a get rich quick scheme...
Attached File
File Type: pdf spiva-us-year-end-2017.pdf   717 KB | 72 downloads
  • Post #3
  • Quote
  • Mar 5, 2019 11:16am Mar 5, 2019 11:16am
  •  TEntropy
  • | Joined Dec 2018 | Status: Member | 51 Posts
A Note About Money Management:

There are two things that are widely known in the discussion of money management:
1. Risk a fixed % per transaction/leg.
2. Kelly Criterion (Formula to optimize what % that should be. Most traders usually use a fraction of the true formula.)

The 2nd, is an enhancement of the first, and the real advantage of the 1st is, mathematically, you can never reach 0. You will hit limits set by the product being traded/your broker before you account would actually ever hit 0.

Now in terms of conventional money management, if this is how you are sizing each trade, this is literally all you can do. Bet less when you lose, and bet more when you win. You could also use a fixed bet size, but then, you are performing any money management at all, as nothing changes as you progress further in time.

If you are not increasing your size after wins and decreasing size after losses or using a fixed position size, you can also increase size after losses and maintain or decrease size after wins.

However, increasing size after losses or increasing size after wins but not decreasing size after losses will guarantee you run into what's called, The Gambler's Ruin. This essentially boils down to the fact that if you do either of the mentioned in the last paragraph, and play for an infinite amount of time, you will eventually blow up, even with a positive expectancy.

In order to get around this mathematical reality is to get creative.

Should you choose to do this, the only way this won't become a serious issue is to break your account into chunks, using a fixed size based on a % of the account, and then rescale the chunks/blocks once a new block is gained or lost. Doing this returns the benefit of risking only a fixed % of your account, in that, mathematically you will never reach 0 but instead will hit product/broker limits before this happens.

This is how I handle my money management and I use a custom algorithm to calculate the size of each transaction in the block based on where I am in the block.
  • Post #4
  • Quote
  • Mar 5, 2019 10:32pm Mar 5, 2019 10:32pm
  •  TEntropy
  • | Joined Dec 2018 | Status: Member | 51 Posts
A Note About Risk:Reward Optimization:

Some argue that all risk:reward ratios are created equally and like most things, not all, but most things, you need to ask in relation to what.

In this case, in relation to our money management strategy. And when it comes to our money management strategy, not all risk:reward ratios are created equal so we need to determine and use the most optimal risk:reward ratio.

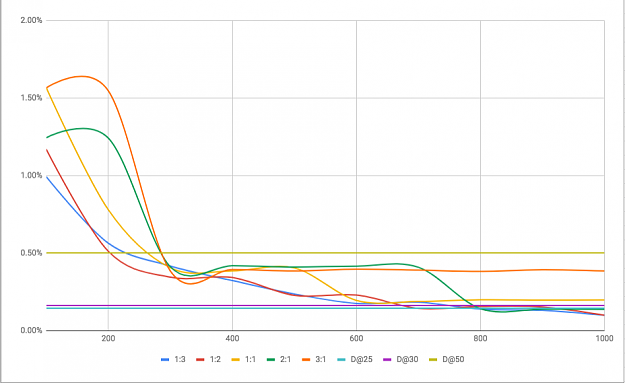
The graph below illustrates how 6 different risk:reward ratios perform with our money management strategy with various amounts of risk:

Attached Image (click to enlarge)
Click to Enlarge

Name: Screen Shot 2019-03-05 at 3.48.03 PM.png
Size: 77 KB


In this graph, the risk per trade decreases as the line movers further along the x-axis. For example, at 100, we are using a target of 1% per trade, at 500 we are using a target of 0.5% per trade, at 1000 we are using a target of 0.1% per trade.

1:3 & 1:2 consistently outperform all of the others and they are almost neck and neck throughout the entire graph. Because I would prefer to have a higher hit rate in general, I have chosen to use 1:2 as my risk:reward ratio.
2
  • Post #5
  • Quote
  • Last Post: Mar 5, 2019 10:58pm Mar 5, 2019 10:58pm
  •  TEntropy
  • | Joined Dec 2018 | Status: Member | 51 Posts
Another Note About the Benchmark:

After optimizing my r:r ratio, I have settled on using a target of 0.1% per trade based on the r:r being used, the number of transactions a day I can expect to have based on the volatility of the product I am trading (GBPUSD), and the relative risk of using these parameters.

--- a quick note on relative risk, and statistics in general with markets ---
Market never changes. To the core, it can only go up or down, since the beginning of time and in the future. But the infinite combination of volume, volatility, increasing number of strategies applied, increasing number of computers algos, will impact and change those parameters. Those parameters will change. Nevertheless, trading is simply capturing a move from point A to point B and that market will always only go up or down. But example a profitable 150pip stop loss may cease to be profitable due to different variables that will take place. A backtest of 14 years, 20 years, 100 years is a small sample size…. A very small sample size to an infinite number or combination.

This infinite combinations means there is always a risk that whatever "edge" I have will cease to exist. Because of this, I base my model on having no edge at all and focus on my risk relative to other events. This does not mean I don't test for statistical edges, it just means when building my model, I account for none and optimize my model to the point that the risk of blowing out, relative to some other event is at a point that makes me feel comfortable to trade it, even if no edge could ever exists.

Again... I am not saying I have no edge, I am just saying I build my risk model as if there were none.
--- end of quick note ---

So with that in mind, those are the main factors of why I have chosen 0.1% as my target per transaction.

Again, based on the volatility of the product I will be trading, I can expect to net 0.1% per day, on average. Some days will be less, some will be more, but it will average out to about 0.1%.

With compounding, this should give me an annual return of 28.51%, nearly 3 times my benchmark goal. This gives me plenty of wiggle room should I not meet my average daily goal, as I will only need to actually meet it one out of every 3 days to beat the benchmark. And because my relative risk is at a level I feel very comfortable trading at, it will be extremely stress less trading, even in periods of draw down.
  • Trading Journals
  • /
  • Partum Pecunia Influunt
  • Reply to Thread
0 traders viewing now
Top of Page
  • Facebook
  • Twitter
About FF
  • Mission
  • Products
  • User Guide
  • Media Kit
  • Blog
  • Contact
FF Products
  • Forums
  • Trades
  • Calendar
  • News
  • Market
  • Brokers
  • Trade Explorer
FF Website
  • Homepage
  • Search
  • Members
  • Report a Bug
Follow FF
  • Facebook
  • Twitter

FF Sister Sites:

  • Metals Mine
  • Energy EXCH
  • Crypto Craft

Forex Factory® is a brand of Fair Economy, Inc.

Terms of Service / ©2021