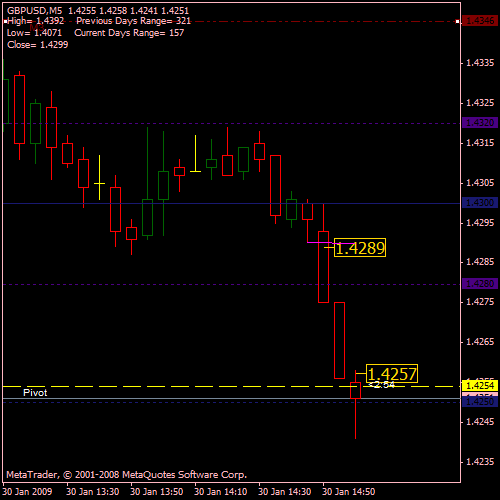
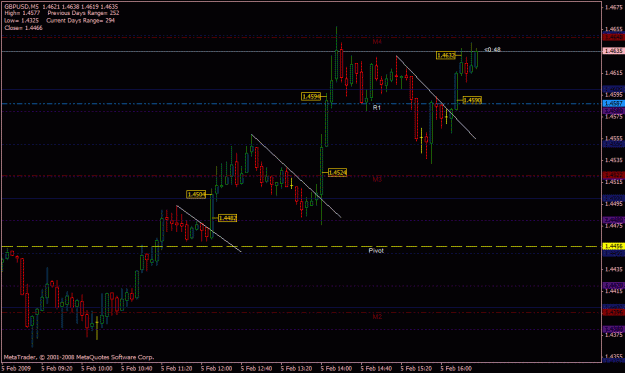
Ever have one of those trades when you wish you'd held on?... This was my entry from a trade on Friday... I got out for +12 pips after 5-10 minutes... carried on up for 350+ pips...
Eyevoltage, do you ever work a strategy with 2 lots?
Ever have one of those trades when you wish you'd held on?... This was my entry from a trade on Friday... I got out for +12 pips after 5-10 minutes... carried on up for 350+ pips...
Eyevoltage, do you ever work a strategy with 2 lots?
Magnus
Ignored
I think we all have those trades from time to time, mate. Jump out with a quick profit, and watch the price continue ever onwards, disappearing into the distance! The secret there, as you no doubt are aware, is to put it behind you, thank the trading gods for their bounty, and wait for the next opportunity.
|
Joined Jun 2007
|
Status: ̿ ̿ ̿̿'̿̿\̵͇̿̿\=(•̪●)=/̵͇̿̿/'̿̿ ̿
|2,727 Posts
It's all in the timing... or not!
Mis-timed this one.
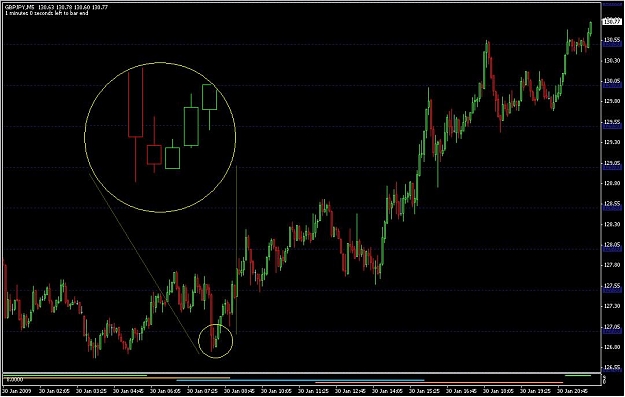
The setup was good - but not clinical. We had an IB, then a subsequent IB (hammer-shaped), then another hammer-shaped bar - I should have perhaps skipped the trade at this point, but both hammers closed above the 126.00 round number. Went long on break of second hammer. Got out when I saw there was no follow-through.
The setup was good - but not clinical. We had an IB, then a subsequent IB (hammer-shaped), then another hammer-shaped bar - I should have perhaps skipped the trade at this point, but both hammers closed above the 126.00 round number. Went long on break of second hammer. Got out when I saw there was no follow-through.
Magnus
Ignored
Magnus, although hindsight is always 20/20, perhaps you'd still find my comments of interest.
"Hammers" work best when they are not "in traffic" (i.e. there is a clear space to the left) and/or when they occur at swing's extreme point (such things are discussed in detail at J16's thread at FF).
Your entry was followed by an infamous "shakeout" (known (by banks) as stop loss hunting); Wyckoff also described such price action as "jumping the creek". One of the solutions (not the best one, though, in my view) would have been to set SL below the prior swings low (that bottom you can see at the left edge of your chart).
As for IBs, it's a personal preference, but they are too frequent on TFs up to H4, to be consistently predictable. There is, however, a good pattern based on IB (http://www.candlesticker.com/Cs61.asp) - you can see it at the bottom of the far left swing on your chart (note how this pattern was absent during the consolidation period, where you took your trade, despite two IBs there).
Just my USD0.02 (I hope I didn't sound "lecturing" - I simply wanted to share my thoughts on that chart )
Magnus, although hindsight is always 20/20, perhaps you'd still find my comments of interest.
"Hammers" work best when they are not "in traffic" (i.e. there is a clear space to the left) and/or when they occur at swing's extreme point (such things are discussed in detail at J16's thread at FF).
Your entry was followed by an infamous "shakeout" (known (by banks) as stop loss hunting); Wyckoff also described such price action as "jumping the creek". One of the solutions (not the best one, though, in my view) would have been to set SL below...
Ignored
You're comments are most welcome...
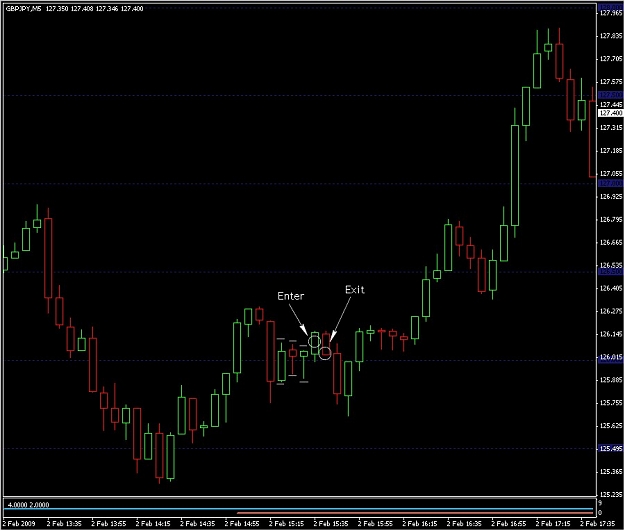
Yes, I can definately see I was shaken out.
I'm aware of the hammer being on it's own. But in this case I kind of free-styled on my PA interpretation and put [perhaps unjustifiable] emphasis on the two hammers closing above the .00 line.
Excellent web-link, thank you Forex007. I feel a perusal coming on.
Joined Sep 2006
|
Status: Son of this Sceptred Isle.
|3,635 Posts
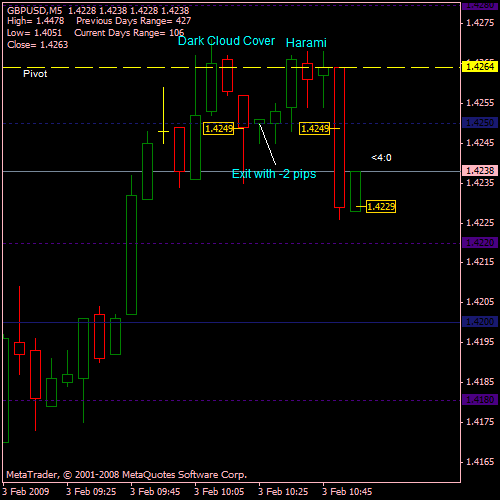
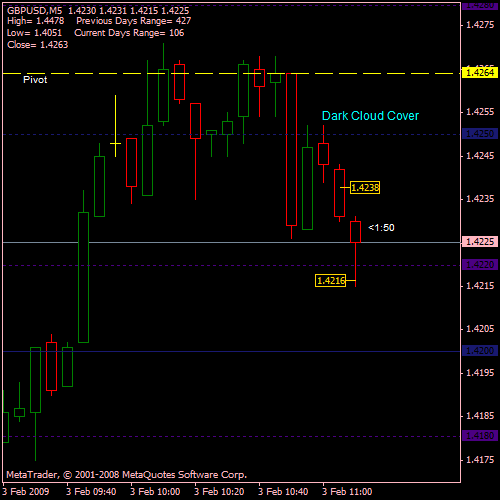
Two trades on 5m cable. The first one looked good to start off with and rapidly deteriorated, ending in a small loss. The second one was better, but still a bit "iffy". The ironic thing about them is that the first reversal indicator was a Dark Cloud Cover, which is usually classified as a high-probability signal, whilst the Harami is usually classified as low-probability. Go figure, as our friends across the pond would say!
Joined Sep 2006
|
Status: Son of this Sceptred Isle.
|3,635 Posts
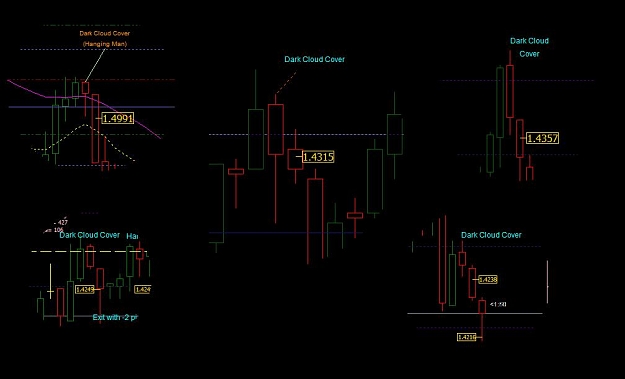
This one was a little more clear cut, but the Dark Cloud Cover's shadows were a little long for my liking. Still, it was worth a go, seeing as it was just below the xx50 psych-line, so I entered just under the low of the DCC's low. My exit was the logical place for me to jump ship, seeing as my target is usually around 20 pips.
Joined Sep 2006
|
Status: Son of this Sceptred Isle.
|3,635 Posts
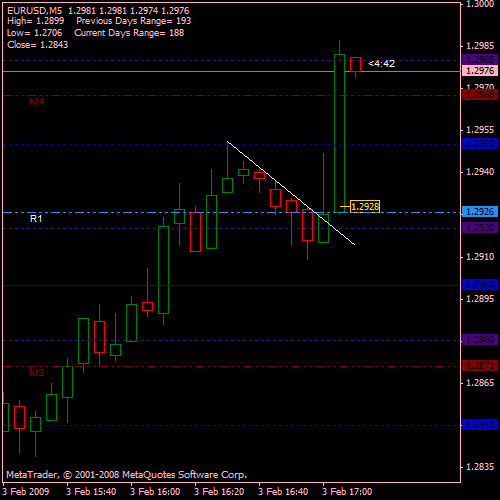
I didn't take this one as some economic news was due, but it's an interesting one. The nice TL marked out a neat retracement and when price broke through, it also had to negotiate its way through the confluence formed by the xx20 psych-line and the R1 line. In cases like these, I would automatically wait for another candle to open above the resistance lines, and I've marked the spot where I would have entered. It would be interesting to know where (under normal circs) others would have entered and exited.
Mr Voltage, could you enlighten me as to how you interpret Dark Cloud Cover?
I'm having difficulty getting my head around it. I've picked some of the examples you have previously posted and are attached below.
Candlesticker describes it here... but, alas, it has somewhat clouded () the issue for me.
Magnus
Ignored
Everybody will have their own opinions on this, but I interpret a DCC candle as follows:
After an obvious or sustained price rise (indicated by my green-edged candles), we get a bearish candle (red-edged) that opens above the close of the previous candle. At the end of that session, it will have closed well into the body of that previous candle, and preferably more than half-way down. If you can't get your head around the term "Dark Cloud Cover", then think of it as a Bearish Piercing Pattern.
Hope that helps.
Edit: If you look at my chart on #1688, you'll see a DCC, but the candle which forms the initial signal is very small. However, the next candle also falls within the body of the last bullish candle, and this strengthens the DCC indication.
|
Joined Jun 2007
|
Status: ̿ ̿ ̿̿'̿̿\̵͇̿̿\=(•̪●)=/̵͇̿̿/'̿̿ ̿
|2,727 Posts
Aaaah... I see it now. I was focusing on how low it reached, retraced and closed compared to the previous bar. But it's actually that there is a gap between the open of the bar in question and the previous bar - and, as you say, how deep it retraces.
Aaaah... I see it now. I was focusing on how low it reached, retraced and closed compared to the previous bar. But it's actually that there is a gap between the open of the bar in question and the previous bar - and, as you say, how deep it retraces.
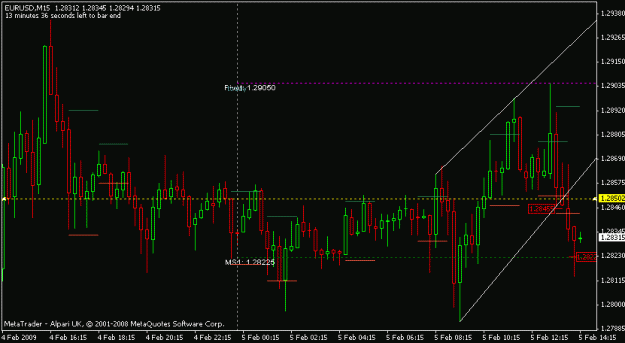
Hi there guys good to know that u are still keeping this great thread alive. I hv not been posting of late not bcos i hv not been trading it just sheer laziness. I just pulled d plug on this one and would love to share. the euro was trading in a channel on d 15 min chart i shorted at 1.2845 just below d breakof support and psych level, i bailed as soon as price started retracing at d MS1 line 1.28225. So EV hw is it going?
Joined Sep 2006
|
Status: Son of this Sceptred Isle.
|3,635 Posts
Nice trade, pipaholic, and nice to see you back.
Here's my day's trading efforts. Like you, pip, I've been a bit lazy regarding posts today, so I've shown them all on one chart. For a change, they've all been results of TL breaks. Self-explanatory, I think, as these trades are probably the easiest to inititiate. Fx1 does a lot of these, and is very successful.
Edit: Actually, the last trade was a bit of a mistake. I was a bit premature in entering, as I should have waited for price to clear the 1.4600 psych-line. Luckily, it worked out, and I've learned a lesson from that.
Joined Sep 2006
|
Status: Son of this Sceptred Isle.
|3,635 Posts
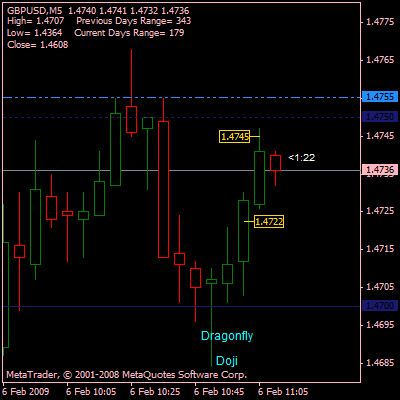
A nice clear opportunity on cable just now. A dragonfly doji formed, straddling the 1.4700 psych-line, so then it was a case of waiting for a confirmation candle, and then entering just above the high of said candle. Price started to retreat short of the R1/xx50 confluence, so it was time to bail out, for a nice 20 pip profit.
A nice clear opportunity on cable just now. A dragonfly doji formed, straddling the 1.4700 psych-line, so then it was a case of waiting for a confirmation candle, and then entering just above the high of said candle. Price started to retreat short of the R1/xx50 confluence, so it was time to bail out, for a nice 20 pip profit.
Ignored
EV, do you know exactly where you are going to get out before getting into this (or any) trade, or is it more of a general watch-the-tick-and-get-a-feeling kind of thing?
Your R:R, on first sight, appears to be quite low. However, your win:loss looks very good.
EV, do you know exactly where you are going to get out before getting into this (or any) trade, or is it more of a general watch-the-tick-and-get-a-feeling kind of thing?
Your R:R, on first sight, appears to be quite low. However, your win:loss looks very good.
Regards,
Magnus
Ignored
Hi Magnus.
I'm always aiming for the next major/minor S/R line, mate, be it a pivot line or a sweetspot. My recent trade was prompted by the fact that the reversal pattern was on or around a support line and the next resistance line (which was also part of a confluence) was a sufficient distance away to make it a healthy TP point. I like to watch the trade, and if there's any suggestion of weakness, I'll bail out. Some might say that it's best to stay in and see what happens, but I've done that before and regretted it. With LT trades and Position trading, then just letting the trade run is the normal way of things, but when one is only after around 20 pips or so at a time, and we're only dealing with ST trades, then I think it's important to protect one's gains as and when it becomes necessary.
I hope that answers your question, mate?
...I like to watch the trade, and if there's any suggestion of weakness, I'll bail out. Some might say that it's best to stay in and see what happens, but I've done that before and regretted it.
Ignored
I can concur with the seeing of weakness. I watch the ticks up and down, or possibly the tick-chart for lack of strength on short-term plays.
Yes, short-term is [relatively] different to long-term trades. I think it's because on such short term TFs one can really see the momentum - or lack thereof! Whereas on longer-term trades there are many factors that may affect the ultimate success of the trade; news, other markets, etc. - I am with the thought that the longer one is exposed to the market, the greater the chances of something adverse happening during any particular trade.