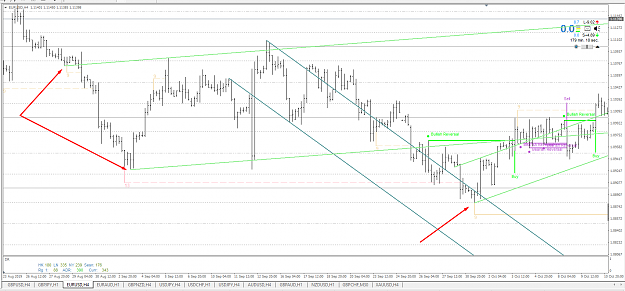
See the last arrow on the right. I'm trying to establish whether that low should have also been a parallel of the 2019.09.05 16:00 "Main" level. {image}
Ignored
You can draw a parallel there yes, SoS does not because then we have lines all over the chart.
In a future PRO version I can fix so that there are options to do this in a proper way.
as I understand you are reffering to this segment, right?
Yes, that's correct. I don't mean to be pedantic in any way but from what I understood from the original document, it seemed that another parallel could be printed at the low and I noticed that SoS hadn't printed it. I just wanted to clarify that my understanding was correct and if so, whether there was a numeric limit imposed somewhere on how many parallels SoS would print. That was all
Yes, that's correct. I don't mean to be pedantic in any way but from what I understood from the original document, it seemed that another parallel could be printed at the low and I noticed that SoS hadn't printed it. I just wanted to clarify that my understanding was correct and if so, whether there was a numeric limit imposed somewhere on how many parallels SoS would print. That was all
Ignored
ofc, the more you ask the more you learn. I enjoy the fact that you are learning the system
I am working on my own Trading/ Analysis Software, it will have ALL features that you can imagine in regards to cylcles...parallels etc.
A PRO SoS Software so to speak.
{quote} ofc, the more you ask the more you learn. I enjoy the fact that you are learning the system I am working on my own Trading/ Analysis Software and it will have ALL features that you can imagine in regards to cylcles...parallels etc. A PRO SoS Software so to speak
Ignored
Very cool indeed! One thing you might want to incorporate in a future version is a hot-key to quickly toggle the indicator's graphical artefacts ON/OFF (cycles/parallels/labels etc). Because of the number of things printed on the chart, sometimes, it would be nice to press, say, the "c" (for "clear") key (to remove the SoS chart output) so you can see the price action without distraction and then, press "c" again, to bring the channels/lines/labels back. It could be some user-defined hotkey value but, you get the idea. I have a few indicators that do that kind of thing and, frankly, it's a godsend when you just want to see price alone.
{quote} Very cool indeed! One thing you might want to incorporate in a future version is a hot-key to quickly toggle the indicator's graphical artefacts ON/OFF (cycles/parallels/labels etc). Because of the number of things printed on the chart, sometimes, it would be nice to press, say, the "c" (for "clear") key (to remove the SoS chart output) so you can see the price action without distraction and then, press "c" again, to bring the channels/lines/labels back. It could be some user-defined hotkey value but, you get the idea. I have a few indicators...
Ignored
I actually always start with clean charts...then try to understand the chart....then launch SoS and everything becomes so clear.
Its a good idea and I will incorporate that. Thanks for the tip!
{quote} I actually always start with clean charts...then try to understand the chart....then launch SoS and everything becomes so clear. Its a good idea and I will incorporate that. Thanks for the tip!
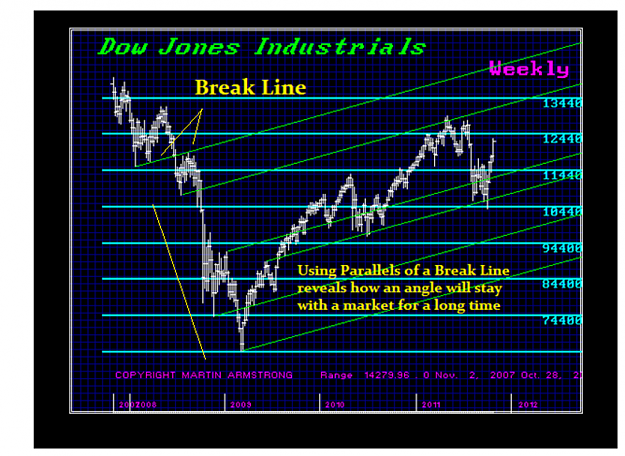
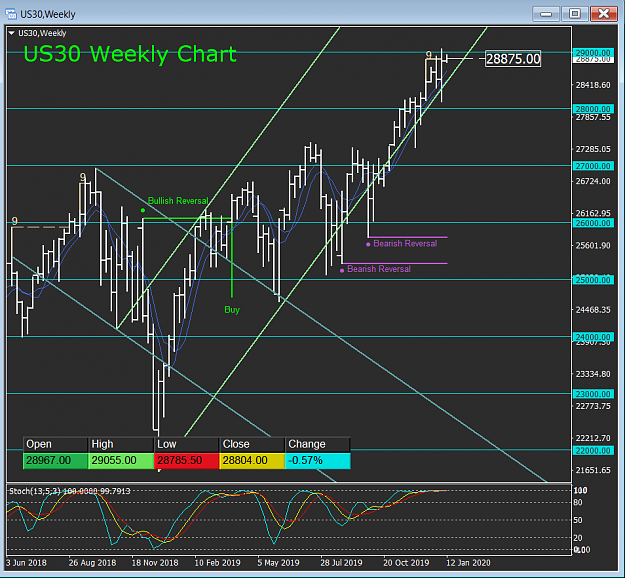
The next turning point in the ECM occurs on the 18th, next saturday. Market opens on Monday the 20th, which is lining up with the arrays on DOW. There is a very big chance of a high forming on the 20th, followed by a strong correctional move down to test cyclical support @ the 22700 area. Looking at the weekly chart, there is a 9 exhaustion pattern, warning that the market is out of energy. A weekly break and close below the channel this next week would indeed be very bearish. Very interesting and prosperous times ahead! {image}
Ignored
DOW is really interesting, currently hovering below the 29000 level... What do you guys think will happen on the ECM turning point next week?
DOW UP or DOWN?
Don't really know what the ECM is so not sure of its impact.
Ignored
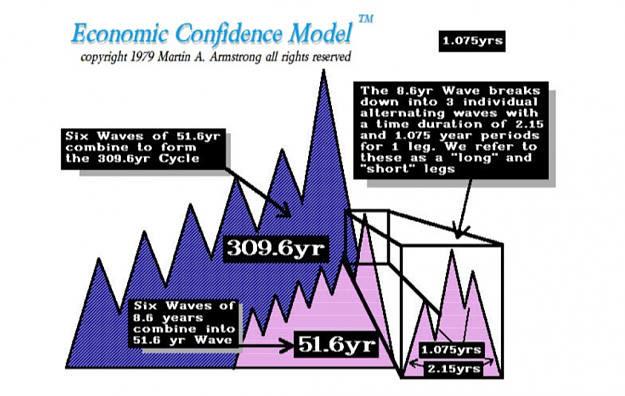
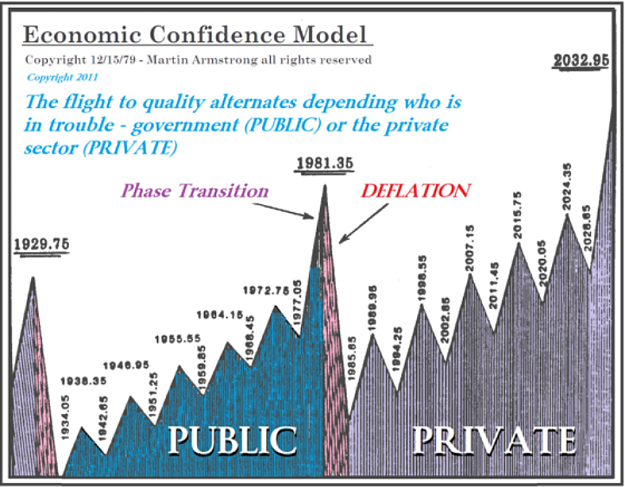
The Economic Confidence Model (ECM), sometimes referred to as the Pi Cycle, is a proprietary core model developed to help comprehend the global economy by tracking international capital concentration. While the ECM does not track an individual security or market (and should not be used to define a specific trade strategy), it helps reveal a timeframe for potential shifts in confidence that may lead to major economic events, up or down.
Understanding
The Economic Confidence Model (ECM), sometimes referred to as the Pi Cycle, is a proprietary core model developed to help comprehend the global economy by tracking international capital concentration. While the ECM does not track an individual security or market (and should not be used to define a specific trade strategy), it helps reveal a timeframe for potential shifts in confidence that may lead to major economic events, up or down.
Each market around the world (an example in this case would be a real estate, bond, stock or commodity market for a given region) has its own cycle, and if a turning point in a given market lines up with the ECM then it is an indication of a potential boom or bust to be mindful of. Capital tends to first concentrate into a single region (which have their own cycles), and then into a single market in that region. This capital concentration tends to lead to a bubble. However, because every market retains its own cycle, it’s when that cycle lines up with the ECM that we’ll see the potential big booms and busts.
The ECM was developed years ago by Martin Armstrong, a world-renowned American economist best known for discovering the link between pi and the business cycle. During his studies, Armstrong came across a list of financial panics between 1683 and 1907 that occurred in various economies throughout the world. By chance, he divided the timeframe between 1683 and 1907 (224 years) by the number of panics (26), and noticed that, on average, a financial panic had occurred every 8.6 years. In an attempt to quantify his findings, Armstrong noted that each 8.6-year wave consisted of roughly 3,141 days, which is equivalent to pi multiplied by 1000 (3.141 *1000).
Curious whether this was a coincidence or correlation, he came across the work of Nikolai Kondratieff who theorized that periods of economic growth and decline occurred on a cyclical basis in phases or waves that built in intensity and led to a major economic event every 50–60 years. Armstrong noted that his list of financial panics from 1683–1907 displayed a similar pattern where major events occurred every 51.6 years after six 8.6-year waves.
Attached Image (click to enlarge)
To test his theory, Armstrong amassed the largest historical monetary database and correlated his findings with major economic events measured by changes in international capital flows. His research revealed a cyclical pattern to the global economy that has existed since the beginning of known currency. Every sixth wave (51.6 years), capital moves back and forth from government to the private sector based on the confidence that people have in each sector. When the majority feels confident and invests in one sector or nation, it leads to overvaluation and an overconcentration of capital that causes financial panics.
Unlike Kondratieff, the ECM acknowledges that not all long waves of economic activity are the same. We have found that in one 51.6-year period, the underlying confidence of the community may reside heavily within the public sector (i.e. government) or be wary of it and turn to the private sector. In either case, the next long wave of 51.6 years will move in the opposite direction. The excess of each sector causes the alternating confidence of the people, which can be determined by monitoring capital movements. During public waves, capital is comfortable residing in government bonds, whereas during private waves, capital begins to diversify into stocks, commodities, business, and real estate.
Attached Image (click to enlarge)
For example, during the 19th century, people became skeptical about government and did not trust its currency. This gave birth to the term “greenback” in the United States and referred to the only backing being the green ink on the reverse side of the note. To inspire the acceptance of unbacked paper currency, there used to be a schedule of interest payments on the reverse. Currency had become merely a strange form of circulating bonds. The long wave that resulted in the Great Depression was a wave of private confidence where people believed more in the virtues of the private sector. This high concentration of private confidence resulted in strong stock markets and expansion in business. When the economy reaches its point of maximum entropy or excess, the correction begins.
By tracking capital concentration, the ECM helps determine the state of confidence and identify when shifts and corresponding economic events may occur. It’s all connected.
Economic Confidence Model Commentary
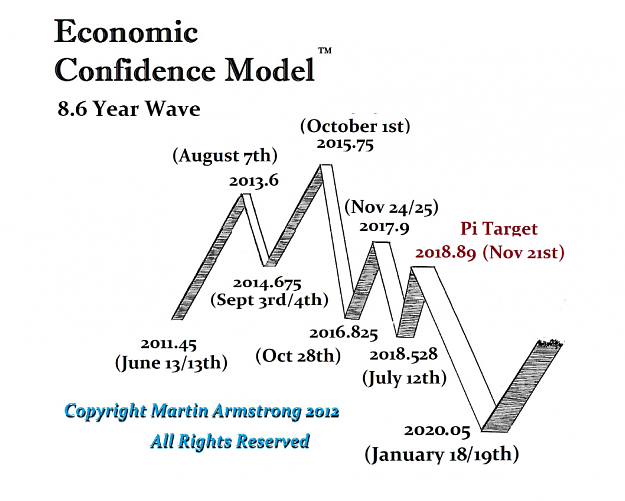
Methodically, the immediate economic outlook remains focused on the next turning point for the global economy due on Sat. Jan. 18, 2020 on a worldwide scale coinciding with our Monetary Crisis Cycle going into 2021 which should have an important impact in the currency markets. At this moment, the world economy overall in moving into a recessary trend in Sat. Jan. 18, 2020 which will vary in intensity from country to country with the least disturbed being the United States at this juncture in time. The next turning point on the ECM thereafter will be Sun. Mar. 13, 2022 and we see this particular cycle as an inflationary one due to the decline in the pruchasing power of the currency rather than a demand expansion caused by shortages in actual goods or commodities. The overall peak in this inflationary trend appears to be targeting the peak of the next 8.6-year wave due in Tue. May 7, 2024, which will align also with the presidential election in the United States. Keep in mind that our political models are also highlighting Tue. May 7, 2024 as a major political turning point where confidence in government will really collapse thereafter going into the culmination of this 51.6-year ECM was due to unfold on Sun. Dec. 12, 2032.
Interesting thread and concept , downloaded-installed the last indicator, but the only thing that I see is the 5 colored bars, nothing else?, any help?
Thanks
Interesting thread and concept , downloaded-installed the last indicator, but the only thing that I see is the 5 colored bars, nothing else?, any help? Thanks
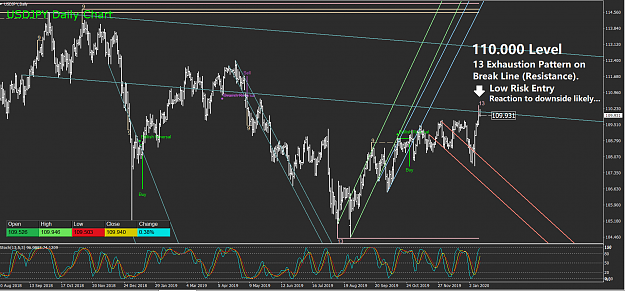
USD/JPY Analysis @ the 110.000 Level
Price have rallied up to resistance, forming a 13 exhaustion pattern right on the break line which is lining up with the 110.000 level.
This presents a low risk trading opportunity to the downside (short) on an Intra-Day basis.
USD/JPY Analysis @ the 110.000 Level Price have rallied up to resistance, forming a 13 exhaustion pattern right on the break line which is lining up with the 110.000 level. This presents a low risk trading opportunity to the downside (short) on an Intra-Day basis. 13 Risk Level: 110.384073, on a closing basis. {image}
Ignored
Were you alerted to this using FX Capital Flow indicator or just by looking at the charts? Do you have a specific watchlist that you use?