Are you one of those traders who are always searching for THE HIGHLY ACCURATE TRADING INDICATOR?
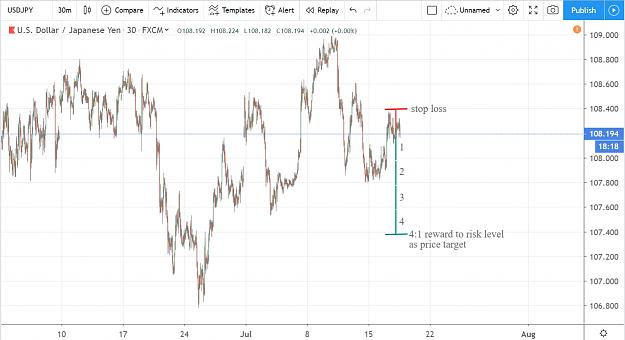
Here is one of my typical trading signal deduced from a math formula
The profitable Repeating Mathematics Pattern working behind the market
**Special Note: this math pattern will not be work every time when it gives an entry signal, but it is profitable for us as long as it is over 25% accuracy rate!**
Here's why.
I scored A+ in Math, Statistics, Logical thinking & an A for Economics in my university 20 years ago, and I see the world in a mathematical way.
The good news is that, after 20 years of backtesting AND FORWARD testing, I have found a simple, repeating math pattern working behind the market. and we don’t need to do advance math to understand & win in the stock market.
Because the entry points are deduced from pure mathematics, unlike other technical indicators that one can change its variables like Moving Average of 14 days to 21 days, or RSI of 14 days to 9 days; Or to connect the trendline from this top A to another top B, but not Top C. there is no ambiguity that one could try to interpret the our math entry signal the other way. This math trading method comes with a precise entry price down to 0.01, and there is only one entry signal per each price cycle.
Because this math is the implicit rule of how the market actually moves, like how you would find the acceleration is the same across all falling objects on earth ( a=F/m=mg/m=g deduced from Newton’s Law of gravitation (the acceleration of falling object is the same and irrelevant of the mass of objects). Our math formula is applicable to all investment products. And the formula tends to work better in an intra-week trading environment; it also works with intra-day trades, but its accuracy rate tend to be a bit lower.
The edge of This math trading method is that it will allow us to continuously engage in high reward low risk opportunities. While this math formula will not correctly predicts its future market movement every time. as you will see my signals history are around 45% right. However, using this method allow me to set "Effective Stop Loss" and each time I am only risking 1/4 of my target, so whenever I am right for one time, it allows me to be incorrect for the upcoming 4 times to break even my earlier winnings. And as long as I am correct more than 25% of the time, my equity would keep growing quick.
Send us an email with the subject: Math Trading FXT to [email protected] to get more details how to apply this math pattern working implicitly behind the stock market.
Here is one of my typical trading signal deduced from a math formula
Attached Image (click to enlarge)
The profitable Repeating Mathematics Pattern working behind the market
**Special Note: this math pattern will not be work every time when it gives an entry signal, but it is profitable for us as long as it is over 25% accuracy rate!**
Here's why.
I scored A+ in Math, Statistics, Logical thinking & an A for Economics in my university 20 years ago, and I see the world in a mathematical way.
The good news is that, after 20 years of backtesting AND FORWARD testing, I have found a simple, repeating math pattern working behind the market. and we don’t need to do advance math to understand & win in the stock market.
Because the entry points are deduced from pure mathematics, unlike other technical indicators that one can change its variables like Moving Average of 14 days to 21 days, or RSI of 14 days to 9 days; Or to connect the trendline from this top A to another top B, but not Top C. there is no ambiguity that one could try to interpret the our math entry signal the other way. This math trading method comes with a precise entry price down to 0.01, and there is only one entry signal per each price cycle.
Because this math is the implicit rule of how the market actually moves, like how you would find the acceleration is the same across all falling objects on earth ( a=F/m=mg/m=g deduced from Newton’s Law of gravitation (the acceleration of falling object is the same and irrelevant of the mass of objects). Our math formula is applicable to all investment products. And the formula tends to work better in an intra-week trading environment; it also works with intra-day trades, but its accuracy rate tend to be a bit lower.
The edge of This math trading method is that it will allow us to continuously engage in high reward low risk opportunities. While this math formula will not correctly predicts its future market movement every time. as you will see my signals history are around 45% right. However, using this method allow me to set "Effective Stop Loss" and each time I am only risking 1/4 of my target, so whenever I am right for one time, it allows me to be incorrect for the upcoming 4 times to break even my earlier winnings. And as long as I am correct more than 25% of the time, my equity would keep growing quick.
Send us an email with the subject: Math Trading FXT to [email protected] to get more details how to apply this math pattern working implicitly behind the stock market.