Hello everyone, this is my first thread on FF since I join this forum. Today I will share my very simple trading strategy. The strategy is stress free if you follow all the rules and have patience to wait all the rules to be fulfilled. If you can do that, you will have an edge in Forex market. First of all, I'm sorry if my English is bad because English is my second language, but I hope you can understand all explanation here I've taught for you.
This strategy is work in any timeframe, any pair, any markets, Forex, CFDs, Indices, Commodities, Stocks.
The Main Strategy
BUY
1. Wait for Stochastic Main and Signal line entering area 0-20
2. Wait for MACD histogram bars are above signal line, must have an angulation between histogram and signal line. Further explanation are below.
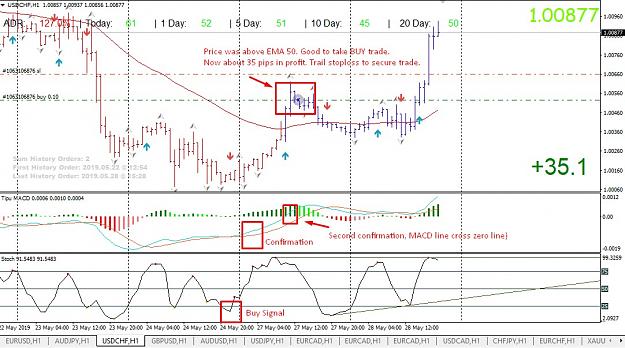
3. If price is above 50 EMA, take the trade.
4. Place stop loss in last swing low (give some space about 50 pips from the swing)
SELL
1. Wait for Stochastic Main and Signal line entering area 80-100
2. Wait for MACD histogram bars are below signal line, and must have an angulation between histogram bars and signal line. See further explanation for angulation.
3. If the price below 50 EMA, take the trade.
4. Place stop loss in last swing high (also give some space about 50 pips from the swing)
Explanation of MACD Angulation
MACD are used for our second confirmation to filter the signal from garbage indicator, Stochastic. I can say, Stochastic is totally garbage indicator, since Stochastic mostly generated fake signal if you take all signal blindly before wait confirmation from other indicators and price action.
MACD indicator is good for our confirmation before taking any trade. When stochastic is giving you a signal, whether buy or sell signal. You have to wait confirmation from MACD. And here is the important thing, we have to notice the angle between MACD line (histogram bars) and signal line, because the angle determine whether the price is currently trending or not.
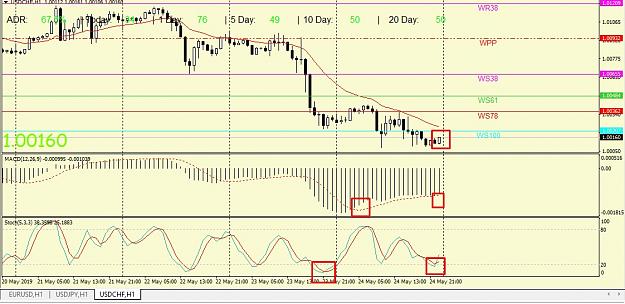
A valid MACD buy signal confirmation is when there an angle between histogram bars and signal line as showed in picture below.
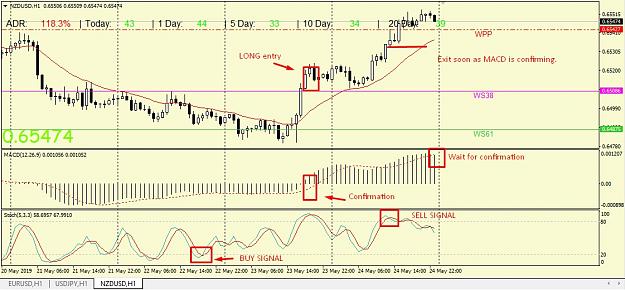
Therefore also the same for MACD sell signal confirmation, see picture below.
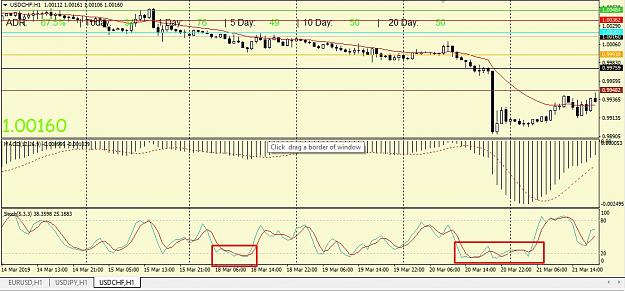
When MACD is become flat and there is NO ANGLE between histogram bars and signal line, we don't take any trade.
You can use traditional MACD or Histogram MACD default indicator in MT4. Are all the same, the histogram in MACD default MT4 is represent MACD line in traditional MACD which can be found in TradingView or custom indicator traditional MACD. MACD can be used as second filter. The first main filter is the BASELINE, remember, don't go short when price is above BASELINE (50 EMA) and don't go short when MACD is currently above zero line. Don't go long when price currently is below the BASELINE and MACD is currently below zero line.
Stochastic Explanation
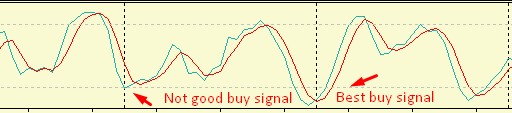
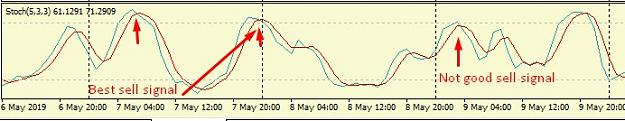
Stochastic is our base indicator to generate buy signal or sell signal. The best signal is when 2 lines (the main and signal line) are in the 0-20 for buy signal and 80-100 for sell signal. The aggressive one is when other line is not between those zones, when the Stochastic main line is entering zone 0-20 but the signal line but the signal line is not entering that zone, this is also buy signal but not good because one of stochastic line are not in the zone. And for sell signal is also the same, when one of stochastic line is not in zone between 80-100, this is not good sell signal, but you can take the signal as base signal and wait confirmation from MACD and price action. The %K line entering zone 0-20 and 80-100 or zone 0-30 and 70-100 is also considered as signal.
Buy signal
Sell signal
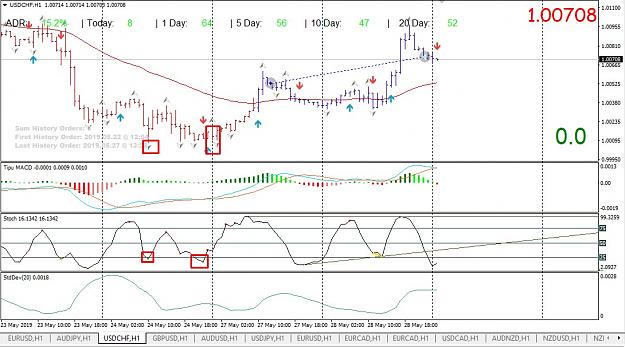
Divergence Using Stochastic
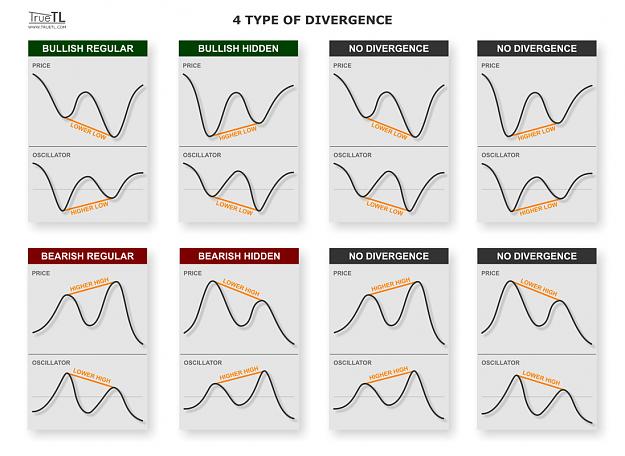
According to George C. Lane, Stochastic indicator is created to trade divergence and not for blindly take any signal whenever it goes oversold or overbought, as we know that there is no such thing about overbought and oversold in Forex market. The fact is, forex is purely about supply and demand. The price is never too high and never too low. Divergence is early momentum change that we can expect for reversal or continuation.
Divergence can occur in oscillator based indicator like Stochastic. Regular divergence usually is early trend reversal, and hidden divergence is usually trend confirmation.
When regular divergence is occur, we must wait confirmation from lagging indicator like MACD or EMA 50 before take any trade. When hidden divergence is occur, we can add another position and we expect trend is still continue.
The Baseline
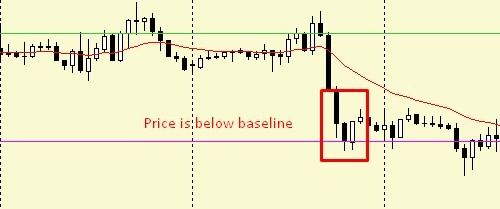
Finally, after all indicator is confirming the signal, then our final decision is look for Price Action is above or bellow our baseline. Our baseline is 20-period of Exponential Moving Average. The baseline is important factor for final decision when we want to take buy signal or sell signal. When the base indicator (Stochastic) giving signal, then MACD is confirming, we have to look price is above baseline or below baseline. Take buy signal when price is above baseline, and take sell signal is the price is below baseline.
Price is currently below the baseline
Price is currently is above the baseline
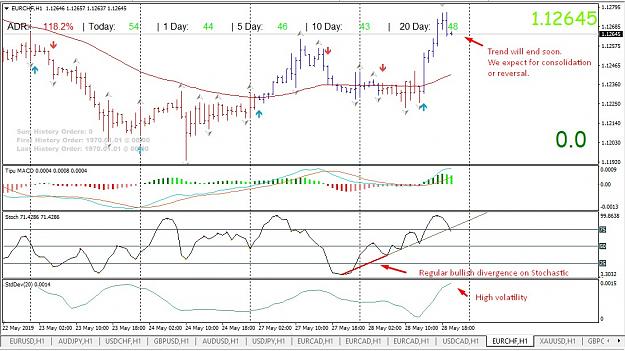
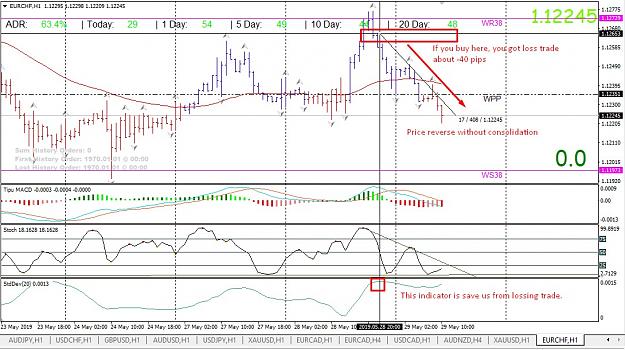
Measuring Volatility with Standard Deviation
This is optional but can be another factor to make us confidence to to place order. Volatility is important in trade, low volatility the market is is almost dead with no movement or only move in very small range, this is also called thin market due lack of liquidity. Measuring volatility is also important for us to expect next big move when market is start trending. To measure volatility, I use indicator Standard Deviation. This indicator is come with MT4 default indicator. The low reading of standard deviation means low volatility, and high reading of standard deviation is high volatility. When volatility is high, we expect trend will end soon and will change or going consolidation.
Big Candle, Long Wick
This is also important thing to be noticed before placing a trade. When price is too far from EMA 50 or previous candle is big candle, don't place any trade, because your SL would be very wide. Big candle can be caused by: news, big-banks stop hunting, or the market just want to be in that direction.
Where to Place Stop-Loss?
I believe there is no holy grail in trading, but how we can manage to not losing and minimize the risk of losing in Forex trading. Placing Stop-Loss is very important since we don't know when spikes happen or when market goes against our trade. I recommended to look for last swing to place stop-loss, but make sure to give some space about 30-50 pips from the swing. You can also refer to Davit's Pivot Level Weekly Support and Resistance to place your stop loss.
This space is important because we know the market is not moving in straight line, when price reaching the swing in case it goes against our trade, there is some space before it actually going back to our trade direction. But, when your SL is hit, no problem, you have your risk limitation in there, because we EXACTLY DON'T KNOW the future movement for the market, we all doing analysis base on PAST DATA or HISTORY. So when market moves against us, we already know our risk limitation.
2 Percent Money Management Rule
Maybe some of you wonder this is just a myth, but risking only 2% per trade is important so you are not going to over trade that lead you to margin call if you are over trading. When we losing our trade, we only losing 2% of our equity because we only risking 2%. So when you decide where to put your stop loss, you have to calculate the LOT SIZE to get 2% maximum of risk.
The formula is:
Lot size = 2% * Equity / Stop-loss (pips)*tick value
For all currency ***USD tick value is 10 USD.
If you're using point as the stop loss calculation, then tick value is 1 USD for all pair ***USD.
And for pair USD*** tick value is not exact 10USD, tick value is about 9.8 USD make sure to check tick value of each cross pair.
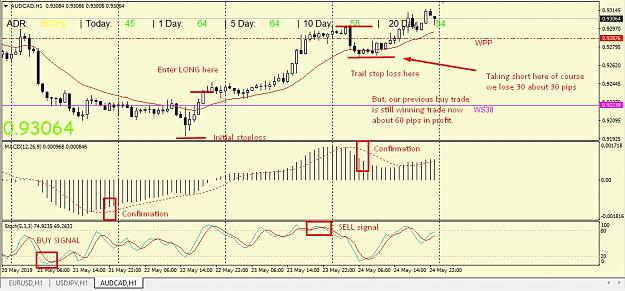
When to Exit?
Exiting is another important things. Because when we don't know when to exit, our winning trade will turn into losing trade soon. The best time to exit is when there is opposite signal. So, let's say our buy trade is in winning condition, then sell signal is appear, then I will close my buy trade. If you not exit when another signal is show up, the higher chance is your winning trade will turning into losing trade.
Do I have to use Trailing Stop?
Yes, you can use trailing stop by moving the stop loss to recent swing to lock your trade so your trade become zero risk when you in winning trade. When market turned against you, you can still Break Even or get some pips if you already trail your stop loss. I don't recommend to trail the stop loss based on EMA since the price can be around the EMA, so better option is trail the stop-loss to the last new swing and exit immediately when opposite signal is shown up, don't wait until the price hit your SL because trailing stop loss is just option to make our trade become zero risk when it's in winning condition.
Patience is Important
This strategy is can be used in any timeframe. You can scalp the market and you trade on M15 chart, if you are day trading then use M30 or 1 hour chart. If you are swing trader, use 4-hour chart. But the important thing is patience. You have to wait all rules to be fulfilled, all indicator must confirm before taking any trade, the patience is for waiting all 3 indicator confirming to take the trade.
The Indicators
This is all indicator used in this strategy.
1. Stochastic (5,3,3) is the main indicator to generate buy and sell signal.
2. MACD (12,26,9) is the second indicator as a confirmation indicator. You can use either traditional MACD or Histogram MACD on MT4's default indicator.
3. Exponential Moving Average period 50 is the BASELINE, final confirmation for our algorithm.
4. Weekly Pivot Indicator, to identify possible support and resistance (check on Davit's thread Pivot Trading).
5. ADR indicator to identify average daily range of the markets.
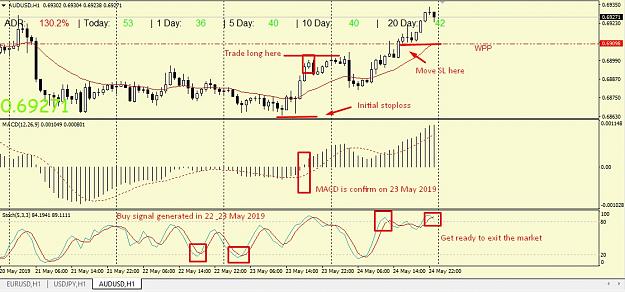
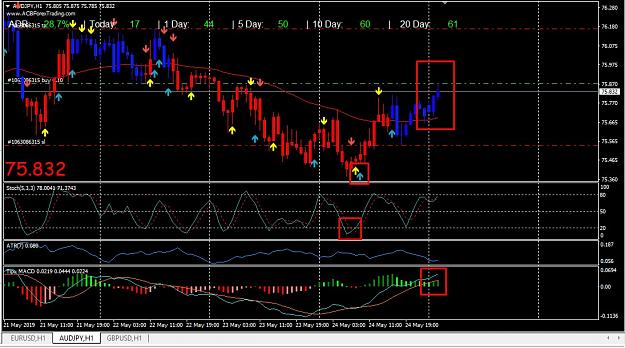
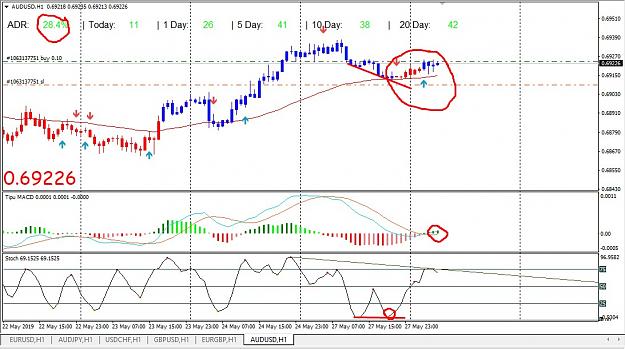
I will post several my trade chart later in next post to give example of how we enter and exit the market based on the algorithm.
Finally here is all the indicators and template.
This strategy is work in any timeframe, any pair, any markets, Forex, CFDs, Indices, Commodities, Stocks.
The Main Strategy
BUY
1. Wait for Stochastic Main and Signal line entering area 0-20
2. Wait for MACD histogram bars are above signal line, must have an angulation between histogram and signal line. Further explanation are below.
3. If price is above 50 EMA, take the trade.
4. Place stop loss in last swing low (give some space about 50 pips from the swing)
SELL
1. Wait for Stochastic Main and Signal line entering area 80-100
2. Wait for MACD histogram bars are below signal line, and must have an angulation between histogram bars and signal line. See further explanation for angulation.
3. If the price below 50 EMA, take the trade.
4. Place stop loss in last swing high (also give some space about 50 pips from the swing)
Explanation of MACD Angulation
MACD are used for our second confirmation to filter the signal from garbage indicator, Stochastic. I can say, Stochastic is totally garbage indicator, since Stochastic mostly generated fake signal if you take all signal blindly before wait confirmation from other indicators and price action.
MACD indicator is good for our confirmation before taking any trade. When stochastic is giving you a signal, whether buy or sell signal. You have to wait confirmation from MACD. And here is the important thing, we have to notice the angle between MACD line (histogram bars) and signal line, because the angle determine whether the price is currently trending or not.
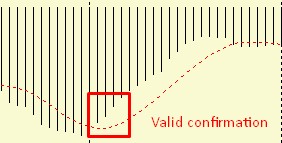
A valid MACD buy signal confirmation is when there an angle between histogram bars and signal line as showed in picture below.
Attached Image
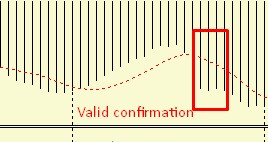
Therefore also the same for MACD sell signal confirmation, see picture below.
Attached Image
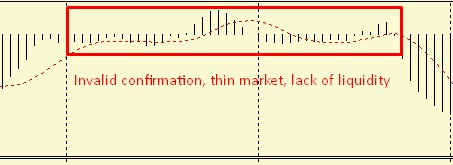
When MACD is become flat and there is NO ANGLE between histogram bars and signal line, we don't take any trade.
Attached Image
You can use traditional MACD or Histogram MACD default indicator in MT4. Are all the same, the histogram in MACD default MT4 is represent MACD line in traditional MACD which can be found in TradingView or custom indicator traditional MACD. MACD can be used as second filter. The first main filter is the BASELINE, remember, don't go short when price is above BASELINE (50 EMA) and don't go short when MACD is currently above zero line. Don't go long when price currently is below the BASELINE and MACD is currently below zero line.
Stochastic Explanation
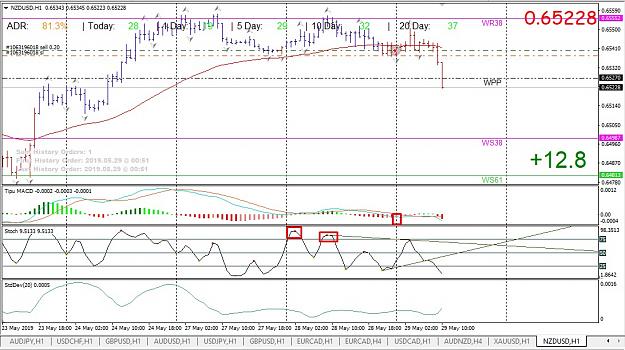
Stochastic is our base indicator to generate buy signal or sell signal. The best signal is when 2 lines (the main and signal line) are in the 0-20 for buy signal and 80-100 for sell signal. The aggressive one is when other line is not between those zones, when the Stochastic main line is entering zone 0-20 but the signal line but the signal line is not entering that zone, this is also buy signal but not good because one of stochastic line are not in the zone. And for sell signal is also the same, when one of stochastic line is not in zone between 80-100, this is not good sell signal, but you can take the signal as base signal and wait confirmation from MACD and price action. The %K line entering zone 0-20 and 80-100 or zone 0-30 and 70-100 is also considered as signal.
Buy signal
Attached Image
Sell signal
Attached Image (click to enlarge)
Divergence Using Stochastic
According to George C. Lane, Stochastic indicator is created to trade divergence and not for blindly take any signal whenever it goes oversold or overbought, as we know that there is no such thing about overbought and oversold in Forex market. The fact is, forex is purely about supply and demand. The price is never too high and never too low. Divergence is early momentum change that we can expect for reversal or continuation.
Divergence can occur in oscillator based indicator like Stochastic. Regular divergence usually is early trend reversal, and hidden divergence is usually trend confirmation.
When regular divergence is occur, we must wait confirmation from lagging indicator like MACD or EMA 50 before take any trade. When hidden divergence is occur, we can add another position and we expect trend is still continue.
Attached Image (click to enlarge)
The Baseline
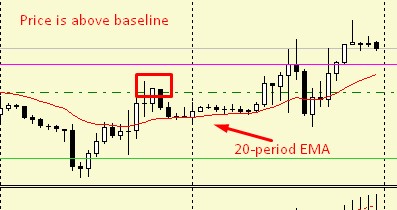
Finally, after all indicator is confirming the signal, then our final decision is look for Price Action is above or bellow our baseline. Our baseline is 20-period of Exponential Moving Average. The baseline is important factor for final decision when we want to take buy signal or sell signal. When the base indicator (Stochastic) giving signal, then MACD is confirming, we have to look price is above baseline or below baseline. Take buy signal when price is above baseline, and take sell signal is the price is below baseline.
Price is currently below the baseline
Attached Image
Price is currently is above the baseline
Attached Image
Measuring Volatility with Standard Deviation
This is optional but can be another factor to make us confidence to to place order. Volatility is important in trade, low volatility the market is is almost dead with no movement or only move in very small range, this is also called thin market due lack of liquidity. Measuring volatility is also important for us to expect next big move when market is start trending. To measure volatility, I use indicator Standard Deviation. This indicator is come with MT4 default indicator. The low reading of standard deviation means low volatility, and high reading of standard deviation is high volatility. When volatility is high, we expect trend will end soon and will change or going consolidation.
Big Candle, Long Wick
This is also important thing to be noticed before placing a trade. When price is too far from EMA 50 or previous candle is big candle, don't place any trade, because your SL would be very wide. Big candle can be caused by: news, big-banks stop hunting, or the market just want to be in that direction.
Where to Place Stop-Loss?
I believe there is no holy grail in trading, but how we can manage to not losing and minimize the risk of losing in Forex trading. Placing Stop-Loss is very important since we don't know when spikes happen or when market goes against our trade. I recommended to look for last swing to place stop-loss, but make sure to give some space about 30-50 pips from the swing. You can also refer to Davit's Pivot Level Weekly Support and Resistance to place your stop loss.
This space is important because we know the market is not moving in straight line, when price reaching the swing in case it goes against our trade, there is some space before it actually going back to our trade direction. But, when your SL is hit, no problem, you have your risk limitation in there, because we EXACTLY DON'T KNOW the future movement for the market, we all doing analysis base on PAST DATA or HISTORY. So when market moves against us, we already know our risk limitation.
2 Percent Money Management Rule
Maybe some of you wonder this is just a myth, but risking only 2% per trade is important so you are not going to over trade that lead you to margin call if you are over trading. When we losing our trade, we only losing 2% of our equity because we only risking 2%. So when you decide where to put your stop loss, you have to calculate the LOT SIZE to get 2% maximum of risk.
The formula is:
Lot size = 2% * Equity / Stop-loss (pips)*tick value
For all currency ***USD tick value is 10 USD.
If you're using point as the stop loss calculation, then tick value is 1 USD for all pair ***USD.
And for pair USD*** tick value is not exact 10USD, tick value is about 9.8 USD make sure to check tick value of each cross pair.
When to Exit?
Exiting is another important things. Because when we don't know when to exit, our winning trade will turn into losing trade soon. The best time to exit is when there is opposite signal. So, let's say our buy trade is in winning condition, then sell signal is appear, then I will close my buy trade. If you not exit when another signal is show up, the higher chance is your winning trade will turning into losing trade.
Do I have to use Trailing Stop?
Yes, you can use trailing stop by moving the stop loss to recent swing to lock your trade so your trade become zero risk when you in winning trade. When market turned against you, you can still Break Even or get some pips if you already trail your stop loss. I don't recommend to trail the stop loss based on EMA since the price can be around the EMA, so better option is trail the stop-loss to the last new swing and exit immediately when opposite signal is shown up, don't wait until the price hit your SL because trailing stop loss is just option to make our trade become zero risk when it's in winning condition.
Patience is Important
This strategy is can be used in any timeframe. You can scalp the market and you trade on M15 chart, if you are day trading then use M30 or 1 hour chart. If you are swing trader, use 4-hour chart. But the important thing is patience. You have to wait all rules to be fulfilled, all indicator must confirm before taking any trade, the patience is for waiting all 3 indicator confirming to take the trade.
The Indicators
This is all indicator used in this strategy.
1. Stochastic (5,3,3) is the main indicator to generate buy and sell signal.
2. MACD (12,26,9) is the second indicator as a confirmation indicator. You can use either traditional MACD or Histogram MACD on MT4's default indicator.
3. Exponential Moving Average period 50 is the BASELINE, final confirmation for our algorithm.
4. Weekly Pivot Indicator, to identify possible support and resistance (check on Davit's thread Pivot Trading).
5. ADR indicator to identify average daily range of the markets.
I will post several my trade chart later in next post to give example of how we enter and exit the market based on the algorithm.
Finally here is all the indicators and template.
Attached File(s)