thanks my man.... price goes up and stops...ok then down and stops got it... then back up...sure does.... then back DOWN!..... he he gotcha..... the geepys long term future seems obvious to anyone with half a brain.... fundamentals alone could tell ya the story....anyway, I hope i wasn't too presumptuous in posting a real time geppy chart ....just thought the geppy is the best to learn in real time as it moves fast and furious..and we can hit them fibs quickly as we learn.... anyway....
1. MR. Super Skunny writes: "There are some good posts here that go in the right direction and then it becomes over thought and goes off track"
It would be nice to know which parts of which posts to concentrate on and so we can ignore the rest of the noise......
2. O.K i learned something new... forget multiple time frames and concentrate on one time frame.... OK I choose to concentrate on the geppy daily time frame since we can post a chart each day and learn..... if that's acceptable to you o supper master sensei....
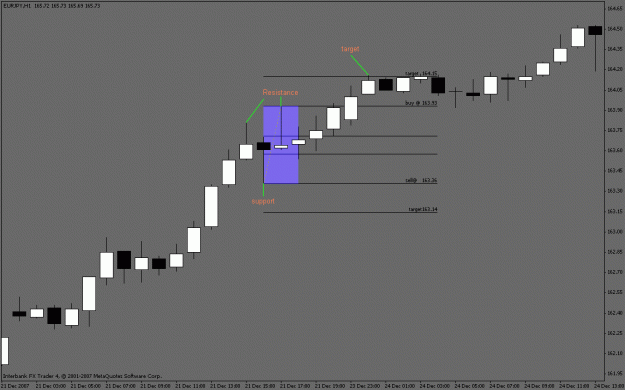
Now.... back to my learning experiment with the geppy.... 1. have i drawn my fibs correctly? I used a tool to do it? If not...why not? assuming I did, and we just going to use the daily fibs as suggested, then we should see the -138 extention and then possibly the -161 extention soon and then bounce back up... am i getting this>>> Interestingly enough the extentions line up with support...hmmmmmmmmmmmmm, I noticed in vhands that Trendline supports and Resistances are sometimes penetrated but fail to break and make a maor move...they just get penetrated and form a big ole pinbar.....and even if support is penetrated.... its only penetrated enough to hit 138 or 161 extentions..... no THAT IS something isn't it! aS A STUDENT OF tOM dEMARK AND BIG FAN OF TRENDLINES AND SUPPORT AND RESITANCE LINES AND HOW PRICE REACTS AROUND THEM.....I CAN SEE HOW THIS CAN BE....OK i AM RAMBLING.... I'm going to shut up now and let all you more experienced traders take it from here and teach me.....
PS In answer to my own quiz....IF my assumptions are correct then the next geppy move would be down to the -138 and then probably back up for a bit before the bigger move DOWN...... Of course I'm a nooob so I could just be wrong again...no biggie if I am.... MM helps with that..... If I am way off base I can alwasy go back to my favorite indicator = flipping a coin ( very important to remember that Tails = long and heads = short, this is where many traders get screwed up!!!!!) wishing you all good success in the new year!
post a marked chart, please god not the geppy, and show us where you think it is and why that might help.
Sizz
Ignored
Sorry just popped by in and saw your message. That would be great, I have to leave again but will try and locate a chart that i can point out what's confusing me ( may not be until late or in the morning). I appreciate your concern and generosity! Adios
thanks my man.... price goes up and stops...ok then down and stops got it... then back up...sure does.... then back DOWN!..... he he gotcha..... the geepys long term future seems obvious to anyone with half a brain.... fundamentals alone could tell ya the story....anyway, I hope i wasn't too presumptuous in posting a real time geppy chart ....just thought the geppy is the best to learn in real time as it moves fast and furious..and we can hit them fibs quickly as we learn.... anyway....
1. MR. Super Skunny writes: "There are some good posts here that go in the right direction and then it becomes over thought and goes off track"
It would be nice to know which parts of which posts to concentrate on and so we can ignore the rest of the noise......
2. O.K i learned something new... forget multiple time frames and concentrate on one time frame.... OK I choose to concentrate on the geppy daily time frame since we can post a chart each day and learn..... if that's acceptable to you o supper master sensei....
Now.... back to my learning experiment with the geppy.... 1. have i drawn my fibs correctly? I used a tool to do it? If not...why not? assuming I did, and we just going to use the daily fibs as suggested, then we should see the -138 extention and then possibly the -161 extention soon and then bounce back up... am i getting this>>> Interestingly enough the extentions line up with support...hmmmmmmmmmmmmm, I noticed in vhands that Trendline supports and Resistances are sometimes penetrated but fail to break and make a maor move...they just get penetrated and form a big ole pinbar.....and even if support is penetrated.... its only penetrated enough to hit 138 or 161 extentions..... no THAT IS something isn't it! aS A STUDENT OF tOM dEMARK AND BIG FAN OF TRENDLINES AND SUPPORT AND RESITANCE LINES AND HOW PRICE REACTS AROUND THEM.....I CAN SEE HOW THIS CAN BE....OK i AM RAMBLING.... I'm going to shut up now and let all you more experienced traders take it from here and teach me.....
PS In answer to my own quiz....IF my assumptions are correct then the next geppy move would be down to the -138 and then probably back up for a bit before the bigger move DOWN...... Of course I'm a nooob so I could just be wrong again...no biggie if I am.... MM helps with that..... If I am way off base I can alwasy go back to my favorite indicator = flipping a coin ( very important to remember that Tails = long and heads = short, this is where many traders get screwed up!!!!!) wishing you all good success in the new year!
Ignored
Keeping it simple means to stay off long term trades, you don't need to know where it might end up in 3 weeks.When you create a fib range price can retrace anywhere in that range, this could be hundreds to thousands of pips. You would need to enter the market in "hedge fashion" if you are going to concentrate on getting a large move.
Here is an example of support and resistance setting up on 2 hourly candles. Each candle marked clearly shows that one candle found support while the other found resistance.
If you want to know where price is heading start small. Hourly charts are the most accurate throughout the world time table. 4hr/daily can start at different times giving you different candles depending on your broker's start time. So, I trade 1 hour most often.
Ignored
Thanks Skunny!
This simple little chart is exactly what I needed. Easy to understand. I know I am confusing myself by trying to figure out complex long term moves.
[quote=Skunny;1777797]Keeping it simple means to stay off long term trades, you don't need to know where it might end up in 3 weeks.When you create a fib range price can retrace anywhere in that range, this could be hundreds to thousands of pips. You would need to enter the market in "hedge fashion" if you are going to concentrate on getting a large move.
Thank you Skunny although I have used fibs in the past I never consider the open and close of a 4hr or 1hr candle as a cycle. This concept is a scalper dream just place orders from fib levels to fib levels according to trend. This also help in deciding the moves with in the moves. The bigger the move the bigger the cycle. Its like taking the elevator or the stairs the choice is yours but we will both get to the next floor. Correct me if I'm wrong the ideal situation will be to draw a fib every hour and see if the levels are leading you up or down with the upper time frame being the strong resistance or support.
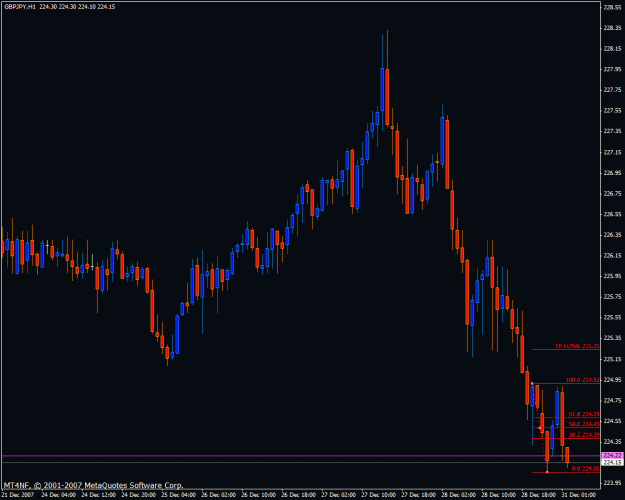
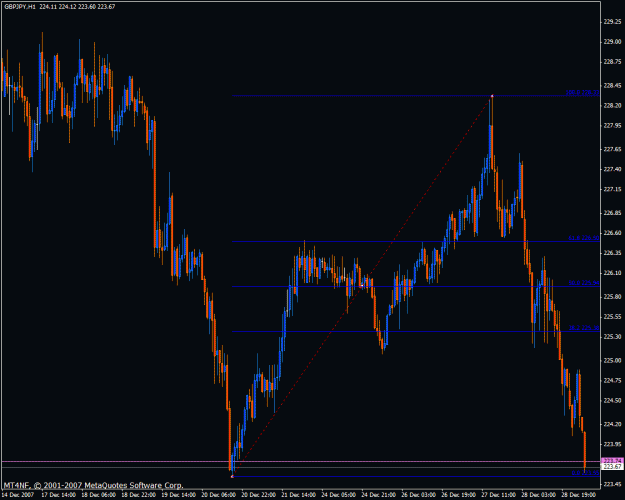
I am making a prediction based on this 1hr G/J chart. If price penetrates either 224.92 or 224.06 it will hit the ext. on that side before it breaks the other side again.
Lets see!
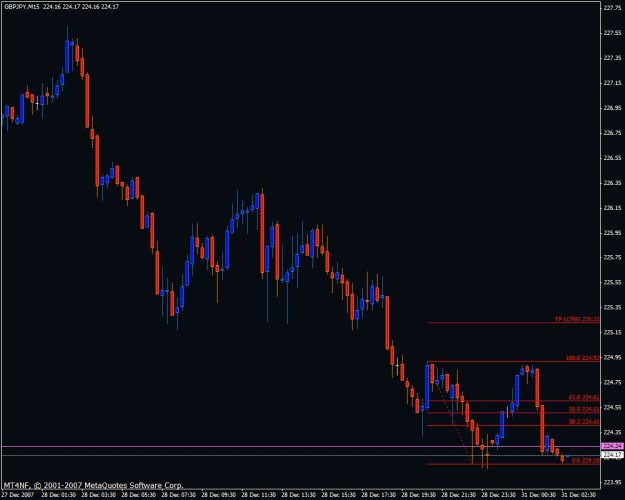
Ok, same pair 15 min tf. Based on the penetration of 2 candles through the 0.0 line. I predict price WILL hit the lower ext @ 223.79 before it breaks the 100.0 line.
DON'T TRADE THIS! I am speculating ONLY!
P.S. - As a side note, if you draw a fib on from the bottom of the cute little blue 15 min pin bar on the left, up to the 100.0 line, you will notice that price has found support on the 138.2 ext, which is currently the 0.0 line of our new fib.
I am making a prediction based on this 1hr G/J chart. If price penetrates either 224.92 or 224.06 it will hit the ext. on that side before it breaks the other side again.
Lets see!
Ignored
In this case the price is close enough anyway but make sure you fib the closest resistance as the high if you are going short and the closest support if you go long. I think I said that right....lol. I think you will know what I mean.
15mn GJ isn't an easy read, so make sure you aren't trading against the 1 hour or at least make sure your ext isn't sandwiched by S/R from another move. 1hr is a safer bet for those just starting out.
Ignored
Appreciated Skunny! In this case I am pretty sure price was headed to 223.55 for at least another decent bounce. Because of some longer term Res. there.
Appreciated Skunny! In this case I am pretty sure price is headed to 223.55 for at least another decent bounce. Because of some longer term Res. there.
Care to comment on my 1hr fib?
Ignored
Nice work Lowell I love it when a plan comes together!
I had my tp 3 set at 233.60 because I love round #s tp 4 looks like a no go.. but both were 6's so meh.I got lazy
I agree with that level 223.55 but I can deal with 5 pips
EDIT but I would say if it cracks 223.55 it is go time. I would be looking at the 5 and 15.
I MIGHT draw the 1hr differently just due to the s/r being set at lower levels but maybe as a controlling range. I see 3 different 100's from yours.
I would do that to tag the moves quicker and capitalize on movements faster.
Nice work Lowell I love it when a plan comes together!
I had my tp 3 set at 233.60 because I love round #s tp 4 looks like a no go.. but both were 6's so meh.I got lazy
I agree with that level 223.55 but I can deal with 5 pips
I MIGHT draw the 1hr differently just due to the s/r being set at lower levels but maybe as a controlling range. I see 3 different 100's from yours.
I would do that to tag the moves quicker and capitalize on movements faster.
Sizz.
Ignored
Ditto on the other 100.0s. I should've rephrased this. The blue fib I posted was actually drawn on the 4hr as "controller" as you call it. I have several other small 1hr targets.
Keeping it simple means to stay off long term trades, you don't need to know where it might end up in 3 weeks.When you create a fib range price can retrace anywhere in that range, this could be hundreds to thousands of pips. You would need to enter the market in "hedge fashion" if you are going to concentrate on getting a large move.
Here is an example of support and resistance setting up on 2 hourly candles. Each candle marked clearly shows that one candle found support while the other found resistance.
If you want to know where price is heading start small. Hourly charts are the most accurate throughout the world time table. 4hr/daily can start at different times giving you different candles depending on your broker's start time. So, I trade 1 hour most often.
Ignored
I'm sure this happens to be just a quick setup you found to give us a simple idea of one of the many types of setups you look for. This happens to be the eurjpy, so do you monitor a number of pairs looking for some of the better setups? I couldn't remember if you liked only trading the geppy or not.
then I would dead on with you. from here I would be out and waiting for my next move to be signalled.
I appreciate the simplicity that Skunny vouches for on just following the 1h around. No opinion or forecasts just go with it. It is perfect in the simplicity, but I am wondering if the pricniples that drive the 1h cannot drive a predictive function in larger tfs?
I saw you rock the wheel within a wheel with your 15 min post... it is hard to get away from the mental exercise of predicting(trying) price into the future if for nothing , but fun.
following the 1h has a greater Riskreward and if you do the math a trader would have no need to follow anything but for the most part. buy sell buy sell and never look farther the your nearest tp
POSSIBLY scale out to hold a move
Sizz
EDIT2 I still think that larger tf forecasting would hold immense value to those of us who want to hold carries though. any thoughts?
Looks like we signalled that we are off to the races with The dragon. IMO from spot charting. here comes 221 not using fibs... I fibbed it out earlier.. but I am sure I had it in that direction.
Sizz.
Edit looking back... and watching price we look to be running out of steam I am only comfy right now until 223.1 or tp 4.
also I am looking for counterpoint on those charts.....it would really help me out thanks!
I noticed when pa hits a extension a lot of the time you get a good pin bar then wait for the next swing, that is when you can draw a new fib from new pin bar to the newly made swing(hopefully to another pin bar) an I making any cents?