My kids reckon my choices of songs are boring. How dare they, eh! lol.
Added 1 more fib for tracking price.
Ignored
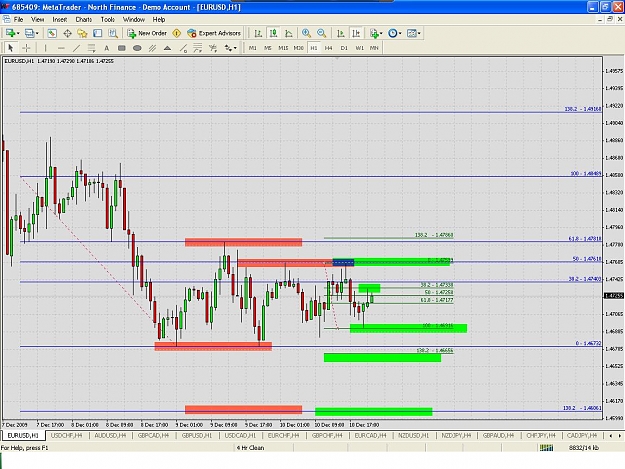
Had a look at your chart, I agree with your smaller fib. Have a look now, price pierced down thru the 0, rejected and rallied then went back down to 0 (good entry point in my book as all the stops have just been cleared out and the smart buyers should come in here 1.4700). Back up to the 50% a la FX Compass.
I've looked through the first 40 pages of this thread. Very interesting stuff. The information is kind of all over the place though. Here's what I gather.
Place Fib from Swing low to swing high.
Trade the break out of the 0 and 100 levels
Place SL at opposite side of the range.
Place TP at the 138 level
Right?
What happened to the earlier posters of this thread? I hope they didn't move on to something else LOL....
Ignored
First of all welcome, I'll try to answer your question how I see it.
1. "Place Fib from Swing low to swing high."
It's not quite that simple, the last few pages may give you a bit more of a hint.
2. "Trade the break out of the 0 and 100 levels."
This would definately seem the case.
3. "Place SL at opposite side of the range."
I think this was hinted at, personally I don't like that idea, I can't bring myself to risk more than I expect to make. There is more to this than that but unfortunately you would have to go through the whole thread. I would consider a move back past the 61.8% inner fib a definate hint to get out or reverse. Money management is down to the individual in the end and common sense of course.
4. "Place TP at the 138 level."
In either direction, yes.
5. "What happened to the earlier posters of this thread? I hope they didn't move on to something else LOL."
Once Skunny left the thread I think the original posters either found a way to trade with this or went onto something else.
The main concept of this thread was Skunny sowing an idea. It was up to us how we fitted it to your own style of trading. In any case it has sprung to life of late and I am enjoying being part of it. I think the last few pages have been the most enlightening of all.
I could just tell you what I know already but there again I could be wrong!
Here is one for GBPJPY. I pulled a fib for the most recent daily bar, and then switched to the 1 hour chart. Price penetrated the 100, but did not close above it. It currently looks like it wants to swing off of the 50% retracement. If it closes above the 100, we're going long?
I have simplified my answers a great deal. You don't just trade a break, you need to define a break from a pierce etc.,
I myself am still interested to know how the older posters are doing. Are you trading this system, idea, whatever you want to call it? Has it been successful for you?
Had a look at your chart, I agree with your smaller fib. Have a look now, price pierced down thru the 0, rejected and rallied then went back down to 0 (good entry point in my book as all the stops have just been cleared out and the smart buyers should come in here 1.4700). Back up to the 50% a la FX Compass.
Am at work presently, I'd better go and do some.
Ignored
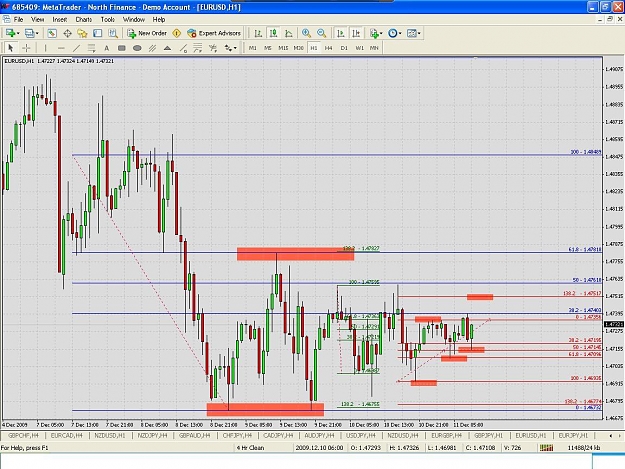
I was thinking it would, after the pierce and retrace to at least head back down to 138.2, but it followed FxCompass's fibs instaed.
I have moved the fibs along.
I suppose if the fib is correctly placed, it should get to 138.2 after a pierce of the 0-100 line. That's what I am trying to figure out as well. The recent postings by ThomKnight have been quite helpful.
Sorry I can't give you a better answer than that.
Let's see what happens during the Tokyo session.
Evening Skong. Just been scanning the thread re weekly candles etc., I'm still looking but have a look at post 679 and 711.
When you moved your fib, had it completed?
Darren.
Ignored
Completed as in reached 138.2? - Then , no, not completed. I moved it because it had retraced past the 61.8 to the 0 line. Should I have kept it there ?
Posts 679 & 711. I see a colorful chart and a reply .
I'm a little hesitant to start this but.......................
This is just an exercise, I am not here to teach a system. Those that want to participate should benefit. What I'm showing you is 1% of what is. This is just a simple step that I believe will help you look at the market a bit different. If you are still looking at the market like 95% of "traders".....well, you know the stats.
Open a weekly chart and blow it up (not literally). Now open your Fibonacci tools and pull a linear fib from the high and low of any candle. Make sure your...
Ignored
Skunny doesn't mention anything about dropping down to lower time frames for this test.
Skong, those 2 posts were relevant to the whole weekly candle thing. I thought you might find them useful.
I'm prety sure we have not completed until we hit 138.2 or -38.2 as per Skunny. I could be wrong, he was so cryptic.
Ignored
Yes, Not completed till 138.2 is hit. Then he might start a new fib from the 138.2.
Something to ponder : Post 1211 Yes, that's true. But you can't jump into the middle of a chart and just pull fibs, you need to go back in time (not way back) and fib all the movements up until where you fibbed to understand where the price sits in relation to the new fib you selected to draw.
Fib all the movements : How ? I thought this means to look at new swing highs and swing lows and walk the fibs. Doesn't looks like that the case.
My 2 cents of what I picked up reading this thread. YMMV.
Definitions:
A Fib - a swing high to a swing low, or a swing low to a swing high in price.
Extension, Projection (outer fibs) – the +1.382 and the -.382 of a cycle (also the 1.628 and the -0.628)
Retracement (inner fibs) – the 0.382 and the 0.618 of a cycle. Other values may include the 0.237, 0.5 and the 0.763 (0.78)
Cycle – Price normally trades in defineable ranges, when price breaks out of this range and hits an extension, a cycle is complete. The Fibonacci tool defines a range as 0.0 to 1.0 and an extension of a range as +1.382 to -.382. A cycle will normally close to the PIP of an extension of price. If it doesn't then the fib is wrong.
Walkin a Fib -?
Fib Cluster - A fib cluster is when you have multiple s/r or ext's that end in the same area (within 10 pips or so). The reason for the 10 pips is usually due to the bad data feeds or manipulation of data. We all have to live with bad data so don't anyone whine about it. Fib clusters add substance to the s/r areas and generally supply I nice hiccup in the move.(which you can trade).
Price Penetration - breach ,poke.
Price Break - closed over
General Concepts:
Price close below Support -> Price goes to Lower Fib Projection (the -0.38 or the -0.62).
Price fails to close below Support -> Price goes to Fib Retracements ( the .62 or the .38).
Price close above Resistance -> Price goes to Fib Projection(the 1.38 or the 1.62).
Price fails to close above Resistance -> Price goes to Fib Retracements( the .62 or the .38).
The "key" seems to be the price action (PA) near the support and resistance areas.
We never ever know when price is going to reverse, but we can have a general idea of direction.
A fib is not fibable ( have predictive value) until the mid level resistance is complete ( the .62 or the .38) ? If the retrace is less then .38 then ignore the retrace, extend the current fib.
A cycle ends when the +1.38 or the -.382 is hit.
If you have a fib and the price goes beyond the 0 or the 100 but does not close, then this is a indication of future price direction. If you have more then one touch of an extreme, the most recent touch indicates the general direction. The master fib is not modified to include the new high or new low. However if price does do go extremes twice ( once above +100 and once below 0 or vice versa), inside of the master fib and does not close above these levels, then this swing may be fibable.
Pin bars, when they occur at the right place in a trend will indicate a trend reversal.
Pin bars can happen at any time, but when they occur at a fib line they usually have more significance.
Pin bars (the wicks) are indication of true support and resistance.
At the end of a completed cycle:
A retracement to the .68 of the last fib indicates a possible major reversal ?
A retracement to the .32 of the last fib indicates a possible temporary reversal ?
A retracement to the .27 of the last fib indicates a the trend will continue ?
If a fib is properly drawn and price does not hit the extension, a temporary reversal may be starting and the extension will eventually be hit. Watch for the next fib cycle(s) to see if they fail.
If a series of fibs start to fail then watch out for a price reversal. They will start to fail on the lower time frames first before they are seen the higher timeframes.
If a fib cycle is properly drawn, a close above the .38 usually means the .62 will be hit and vice versa?
Fibs on a higher time frame have a greater effect on price then on the lower timeframes.If price hits a weekly fib at the 0 or 100, the most likely result is a price bounce. But when price closes below the 0 or above the 100, it usually indicates the general direction of the trade. Sometimes the price movement is very dramatic in the direction of the price close ?
Fibs act the same on all time frames. Cycles within cycles. Cycles always complete and on all time frames. Trading on higher time frames using PA and fibs require larger stops.
If a major reversal occurs at the 32 extension, then this is also a good place to reverse the position ? If the extension of the a higher timeframe fib line is also hit the higher the probability of a bounce and reversal ?
The larger the fib, the better the predictive value. Weekly PA has better predictive value then daily. Daily better then hourly, etc. Weekly trumps daily, daily trumps hourly, etc. If trading hourly you need to know daily PA and fibs levels.
If you want to trade the hourly, you need to determine the direction of the daily and only trade in that direction on the hourly.
The 1hr timeframe is the most consistent time frame around the world. Other timeframes start and stop at different times giving the charts a slightly patterns. Most consistent time frames start at either the London or New York open.
You should have at least 2 fibs running on your chart at all times. There are other active fibs from smaller moves. Typically, but not always, I'll start a new fib from the ext if it hits to the pip or a little short. If it goes over that area I've got some work to do.
You should have a large range fib, with a smaller range fib within the larger fib; trade off the smaller one, in the direction of the larger one.
General trading ideas from various readers. Do not trade this!
#1
I went back and started at random, which happened to be the week of 12/12/04. I went forward 52 weeks, again random, that was just the point at which the phone rang.
Out of 52 samples, the high or low of the weekly candle was breached 50 times, almost always during the very next week. Twice it happened that the high and low were both breached the following week, these were counted. So there were 48 weeks with 1 or more breaches.
Out of the 50 breaches, it hit the 138 before hitting the s/l 39 times (78%). Had you traded it, total pips gained would be 4370.
On the 11 instances where the breach occurred, then price retraced 100% for a stop before hitting the 138, total losses would have been 3509 pips.
In the first half of the test, there were only two losses, totalling 816 pips. The rest were in the second six months, and occurred regularly, therefore, the expectancy of the system would be drastically different, depending on when you started, had you used this as a system.
Edit: this was done on the G/J.
#2
I love pa like little kids love pizza ...hell like I love pizza! and my favorite part are patterns! love them. flags, pennants , channels something like this can now happen: ...
DBHLC with confirmation break of LC in triggering a bearish flag break and which using s/r and flow says it is going to go through a key fib 0 level meaning it is going to end up at least xyz and 400 pips lower. aaaAHhhhAHHAHHaAHHHAAA oh yeah you may have a 10 pip sl on something like that..... hoo dilly! Instead of waiting for the a+ trade set up wait for the a++++ set up. meh me will see.
Makes the mind the blow . That is how I have been primarily looking to apply fibs to my trades Not to change what I do, but to add fibs to it for clarity.
I am testing my way to use fibs as the alpha and omega with pa as the ooey gooey center to be able to play ranges to perfection inside of my encompassing trade.
#3 I've also found some very interesting happenings as well. Like RBing, I've noticed that once penetration fails to reach 138, the PB can be substantial, it reverses to the 162 mark on the opposite end almost 80% of the time. That's backtesting the entire year of 2007. Not only that, but success rate for the entire year (manually) was 85.9%. Now I will look more closely at riding the reversals for some pips!
#4. I manually traded 4 months of Cable this last week. Though far from anything perfect, I didn't do to bad. My rules were simple. Plot the weekly fibs and when a target was hit, I looked to see where another weekly fib existed that was breached but target not hit. So I continued only trading in the overall weekly direction paying attention to all previous support/resistance of weekly bars. If price shot right through my target, then I assumed I was in a different cycle then the one I had on my charts. So I looked for which one I was caught in and began to trade according to it.
#5 Top Down Trading
I traded most pairs using hourly bars high/low on the 5 minute time frame. If the 5 minute bar closes above the 1 hour high, or below the 1 hour low...i took the trade with a TP at the 138 extension. Out of 83 trades...77 hit my TP for a gain. 3 of the losses i chickened out and manually closed them, (they would of hit TP but not quick enough for me). 2 losses i entered at a market top and had to close them. Price never reached TP. 1 loss i entered at a market bottom and had to close it. Price never reached TP. Promising results so far, now i am not taking trades near daily high or lows to avoid losses at tops and bottoms. Also my first 38 trades in a row hit TP! Luck probably...but we'll see over time.
#6 I've also noticed that if retracement does not get past the 38.2 line, the trend will generally continue.
#7 Scalping One of the easiest strategies to implement though for me is to trade from one retracement level to the next. It's not 100% and it's not the "holy grail", but it's clearly a very high probability trade that once a fib S/R level is breached and the price settles on the other side it will continue to approximately the next fib level. I've been setting T/P and S/L conservatively on the other side of the fib level that's been breached and above/below the high/low of the last 1hr bar to close on the other side within reason.
For a while there, I thought it was skunny himself posting. What you posted is definitely worth more than 2 cents.
Anyway with a fresh outlook from thomknights postings, I started trade simimulator again just on the hourly. Only done 2 months so far.
So far, only 1 abberation where price fluctuated between the 1.382 extremes while cutting across the middle 38.2 - 61.8 zone before carrying on its merry way.
As you have stated, when price fails to hit the 138.2 ext at one end, it can heads the other way . A good example was the nu recently.
Rereading some of skunny posts is starting to make more sense now.
That's a great post Srelhead, you must have spent hours researching this thread. Your post illustrates how different people have grasped Skunny's concepts and used them in their own way, which is what I mentioned earlier. Skong and I (if I may presume this Skong), have both picked up on how ThomKnight draws his fibs. Which are close to the original idea I believe.
I think with good money management trading around this concept will be very profitable.
I think I need to stop being lazy and fire up Forex Tester and do a bit (a lot) more testing.