• Home
  • Forums
  • Trades
  • News
  • Calendar
  • Market
  • Brokers
  • Login
  • Join
  • User/Email: Password:
  • 8:18pm
Menu
  • Forums
  • Trades
  • News
  • Calendar
  • Market
  • Brokers
  • Login
  • Join
  • 8:18pm
Sister Sites
  • Metals Mine
  • Energy EXCH
  • Crypto Craft

Options

Bookmark Thread

First Page First Unread Last Page Last Post

Print Thread

Similar Threads

Oanda now has interest free accounts. 22 replies

Why's USD so strong - will Fed raise interest rates? 10 replies

Interest Rate and interest Rates Differentials 11 replies

Strong HKD - Strong Yen? 1 reply

  • Trading Discussion
  • /
  • Reply to Thread
  • Subscribe
  • 6
Attachments: Alright US interest rate 4.75%>>>5.00%? Should be strong for US dollar now?
Exit Attachments
Tags: Alright US interest rate 4.75%>>>5.00%? Should be strong for US dollar now?
Cancel

Alright US interest rate 4.75%>>>5.00%? Should be strong for US dollar now?

  • Last Post
  •  
  • Page 1 2
  • Page 1 2
  •  
  • Post #1
  • Quote
  • First Post: May 11, 2006 5:41am May 11, 2006 5:41am
  •  mvitachi
  • | Joined May 2004 | Status: Member | 22 Posts
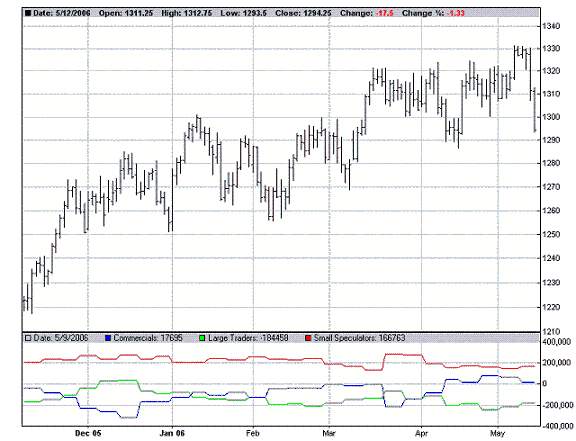
What's up w/ the dollar now? Shouldn't it be going long anytime soon since the fomc raised interest rates. Is it because of the oil prices and gold that's keeping making the dollar weaker?
  • Post #2
  • Quote
  • May 11, 2006 5:47am May 11, 2006 5:47am
  •  migamb
  • | Joined May 2006 | Status: Still Learning | 77 Posts
I've been curious about this myself. I don't know how much the FOMC announcement will help since it was expected so the markets might have adjusted for this in the previous weeks. Not sure why the long term dollar bearish sentiments though.
 
 
  • Post #3
  • Quote
  • May 11, 2006 6:00am May 11, 2006 6:00am
  •  MuddBuddha
  • Joined May 2005 | Status: Member | 945 Posts
check out the COT data...this may help you out. As long as the largest speculators are short the dollar, she aint goin nowhere.

Their decision whether to hold dollar longs or shorts and against which pair is based on much more than just the interest rate itself. It's a much bigger market than that.

Set the chart for any of the currency pairs and check out the long/short numbers on the bottom chart.

http://www.timingcharts.com/index.aspx
Capital Preservation is key to long term wealth accumulation
 
 
  • Post #4
  • Quote
  • May 11, 2006 6:21am May 11, 2006 6:21am
  •  bakrob99
  • | Joined Mar 2006 | Status: Member | 12 Posts
The rate increase had already been priced into the market - it would only have made a difference if:

1. The rate increase didn't happen (stayed at 4.75%)
2. The increase was greater than to 5%
3. The language around the rate increase indicated more (or fewer) future increases

BAKROB
 
 
  • Post #5
  • Quote
  • May 11, 2006 6:31am May 11, 2006 6:31am
  •  smjones
  • Joined Mar 2006 | Status: THANK YOU MERLIN,TWEE and FF Team | 4,603 Posts
Mudd I agree completely. Here is antoher view of it... This is the US Dollar

Scott


Quoting MuddBuddha
Disliked
check out the COT data...this may help you out. As long as the largest speculators are short the dollar, she aint goin nowhere.

Their decision whether to hold dollar longs or shorts and against which pair is based on much more than just the interest rate itself. It's a much bigger market than that.

Set the chart for any of the currency pairs and check out the long/short numbers on the bottom chart.

http://www.timingcharts.com/index.aspx
Ignored
Attached Image
 
 
  • Post #6
  • Quote
  • May 11, 2006 8:02am May 11, 2006 8:02am
  •  nvwine
  • Joined Feb 2005 | Status: Member | 1,747 Posts
Quoting MuddBuddha
Disliked
check out the COT data...this may help you out. As long as the largest speculators are short the dollar, she aint goin nowhere.

Their decision whether to hold dollar longs or shorts and against which pair is based on much more than just the interest rate itself. It's a much bigger market than that.
Ignored
I thought that with commercials so short on the EURO and speculators so long it signaled a reversal of the current trend. 'Extreme positioning identifies reversals.' COT data is not my strength. Did I understand what I read correctly? Your ideas Mudd?
Attached Image
 
 
  • Post #7
  • Quote
  • May 11, 2006 8:28am May 11, 2006 8:28am
  •  MuddBuddha
  • Joined May 2005 | Status: Member | 945 Posts
Well, you really have three layers: small speculators, commercial traders, and large speculators.

Large specualtors often set the overall trend of the market as they regard certain aspects as favorable positions that either oppose or support the dollar.

Commercial traders, like the one's that trade speciafically for brokers and smaller firms, banks, etc., often use the "fade the breakout" technique and are fond of shorting or longing agaisnt the trend. Most brokers hedge against their clients to protect their own equity which also places them in postiions agaisnt the trend as well. But that is the nature of the beast.

Small specualtors, as in you and I, have very little influence over the market and are forever doomed to ride the coat tails of the large speculators as they determine overall trend using whatever logic their dept. heads and advisory boards can conjure as sound. When you get several large specualtors, like Warren Buffets comapnies and others that take postiions for or against the dollar, all acting in a like fashion, they can set trend for months to years.
Normally however, they are as fickle as anyone else and will change strategies on the next fiscal turn around.

Hope that answers your question(?)
Capital Preservation is key to long term wealth accumulation
 
 
  • Post #8
  • Quote
  • May 11, 2006 9:03am May 11, 2006 9:03am
  •  nvwine
  • Joined Feb 2005 | Status: Member | 1,747 Posts
Thanks for your answer Mudd.
 
 
  • Post #9
  • Quote
  • May 11, 2006 9:16am May 11, 2006 9:16am
  •  cristian
  • | Joined Jan 2006 | Status: Member | 27 Posts
Quoting smjones
Disliked
Mudd I agree completely. Here is antoher view of it... This is the US Dollar

Scott
Ignored
Hi Scott,

Where did you get this chart?
Can you explain me how you interpret this chart, or give me a link to read about this?
Thanks,
Cristian
 
 
  • Post #10
  • Quote
  • May 12, 2006 3:18pm May 12, 2006 3:18pm
  •  soso_beton
  • | Joined Feb 2006 | Status: Geometric Trader | 322 Posts
Hi Mudd,

For GBPUSD for example, on what symbols do you look? Cause there is no pair in the page with the chart that is equivalent with GBPUSD, like Eurodollars is for EURUSD (I think). My guts tell me to look at Dollar Index and British Pound - Globex...

-soso
-soso
 
 
  • Post #11
  • Quote
  • May 12, 2006 3:23pm May 12, 2006 3:23pm
  •  soso_beton
  • | Joined Feb 2006 | Status: Geometric Trader | 322 Posts
Oops, sorry for the wasted bandwidth... British Pound - Globex chart is the same witth the GBPUSD chart from my platform so I guess that's the answer.
-soso
-soso
 
 
  • Post #12
  • Quote
  • Edited 3:37pm May 12, 2006 3:25pm | Edited 3:37pm
  •  smjones
  • Joined Mar 2006 | Status: THANK YOU MERLIN,TWEE and FF Team | 4,603 Posts
Yes I subscribe to this sight http://www.cot-futures.com/cot/index.htm

When the commercials and the small investors reach a maximum divergence of 100 and 0 one can usually expect a move in the direction of the commercial traders... thanks Scott

Update:

As an example, this is a chart of the Swiss Franc . If you look back a couple of weeks ago the Commercials reached 100 in their bullishness and the specs and small investors reached nearly 0 in their bullisness. That would mean you could have expected the Swissy to go up, which of course means the USDCHF would go down, because of the inverted nature of the pair. I believe that is exactly what happened.

Hope that helps, Scott


Quoting cristian
Disliked
Hi Scott,

Where did you get this chart?
Can you explain me how you interpret this chart, or give me a link to read about this?
Thanks,
Cristian
Ignored
Attached Image
 
 
  • Post #13
  • Quote
  • May 12, 2006 3:34pm May 12, 2006 3:34pm
  •  soso_beton
  • | Joined Feb 2006 | Status: Geometric Trader | 322 Posts
Scott, as I'm looking at Euro Globex the small investors are long 25K while commercials are short 100K. This is a difference of 125K....I don't quite understand what's with "0 one" in your post. Could you please ellaborate?

Thanks,
-soso
-soso
 
 
  • Post #14
  • Quote
  • May 12, 2006 3:43pm May 12, 2006 3:43pm
  •  smjones
  • Joined Mar 2006 | Status: THANK YOU MERLIN,TWEE and FF Team | 4,603 Posts
We are comparing apples to oranges. I am looking a chart that is put out by this specific company. It measures the following:

NET COMM Net Index for Commercial Traders
| INDEX
| A summary of the weekly number of Long & Short contracts
| (that exceed reportable limits) that are held by
| Commercial Traders each week is issued every two weeks
| by the CFTC.
|
| For each commodity and weekly status a NET Value is
| calculated by subtracting the number of reported Short
| positions from the Long. (spreads are excluded)
| NET = LONG minus SHORT positions.
|
| Over a given period (of weeks) the Index (INDEX) is
| calculated by:
| assigning an index value of 100 to the
| MAXIMUM NET position and
| assigning an index value of zero to the
| MINIMUM NET position.
| Pro-rata index values are assigned to
| IN-BETWEEN NET positions.
|
|
| There may be an increased probability of a price trend
| reversal at the zero or 100 value given a sufficient
| calculation span (see definition SPAN at the Commodity
| list).

this is the legend of how to use the data put out by this company.

Scott
Quoting soso_beton
Disliked
Scott, as I'm looking at Euro Globex the small investors are long 25K while commercials are short 100K. This is a difference of 125K....I don't quite understand what's with "0 one" in your post. Could you please ellaborate?

Thanks,
-soso
Ignored
 
 
  • Post #15
  • Quote
  • May 12, 2006 3:47pm May 12, 2006 3:47pm
  •  Darkstar
  • | Membership Revoked | Joined Nov 2005 | 1,429 Posts
Quoting MuddBuddha
Disliked
Commercial traders, like the one's that trade speciafically for brokers and smaller firms, banks, etc., often use the "fade the breakout" technique and are fond of shorting or longing agaisnt the trend. Most brokers hedge against their clients to protect their own equity which also places them in postiions agaisnt the trend as well. But that is the nature of the beast.
Ignored
I was under the understanding that the commercials were the ones that need to hedge real world exposures. For example in the current environment, euro dollar exporters would need to hedge their currency exposures for products they export to the US. If they didn't, a rising euro value would force them to raise prices, thus reducing demand. The Importers would just ride the current move since their inherently long the euro and benefiting as we go.

I don't use the COT data (too delayed for my style), but would still be interested in getting schooled on the subject.
 
 
  • Post #16
  • Quote
  • May 12, 2006 3:51pm May 12, 2006 3:51pm
  •  smjones
  • Joined Mar 2006 | Status: THANK YOU MERLIN,TWEE and FF Team | 4,603 Posts
Darkstar,

I use this data to get an overall feel of direction in the various commodity markets. I do not use this data for short term trading.

Scott
 
 
  • Post #17
  • Quote
  • May 12, 2006 4:10pm May 12, 2006 4:10pm
  •  smjones
  • Joined Mar 2006 | Status: THANK YOU MERLIN,TWEE and FF Team | 4,603 Posts
This is the weekly chart of USDCHF for that time period. On COT index
Attached Image
 
 
  • Post #18
  • Quote
  • May 13, 2006 8:11am May 13, 2006 8:11am
  •  bakrob99
  • | Joined Mar 2006 | Status: Member | 12 Posts
What do each of the Colors (lines) represent on the chart? In other words - could you explain that chart for us?


Bakrob
 
 
  • Post #19
  • Quote
  • May 13, 2006 8:38am May 13, 2006 8:38am
  •  JosTheelen
  • | Joined Jan 2006 | Status: Member | 151 Posts
Quoting Darkstar
Disliked
I was under the understanding that the commercials were the ones that need to hedge real world exposures. For example in the current environment, euro dollar exporters would need to hedge their currency exposures for products they export to the US. If they didn't, a rising euro value would force them to raise prices, thus reducing demand. The Importers would just ride the current move since their inherently long the euro and benefiting as we go.

I don't use the COT data (too delayed for my style), but would still be interested in getting schooled on the subject.
Ignored
I did last week some calculations on the values from the COT-report. Because of an article in www.investopedia.com about the COT-reports. In that article they showed a currencypair and teh values of its COT-reports. It showed that the COT-reports more or less predicted the direction of that pair for 70% correct. And ofcourse that made me curious.

I took the last years COT-reports of the 5 currencies (pound, euro, yen, canadian dollar and swiss franc). I also took the weekly values of those 5 pairs of the last year. I tried 2 simple systems. The first where I went long each week if the non-commercials in the COT-report had more long futures and I went short short when they had more short futures. In the second system, I went long, if the non-commercials were more bullish than previous weeks and short when they went less bullish. More bullish means that the long futures/short futures went up the last weeks, less means that it went down.

Both systems showed various results, from -12% to +8%. On average a very lttle gain for the first system and a very little loss for the second system. But even that was different for the different pairs. I think, it depends whether that pair was trending in the last year or it was going sideways. In a trending market it can be a little predictive, but not so much. So in my opinion it has hardly any predictive value. Assuming I made no errors in my calculation.
 
 
  • Post #20
  • Quote
  • May 13, 2006 9:41am May 13, 2006 9:41am
  •  narafa
  • Joined Jan 2005 | Status: Keep Learning | 1,180 Posts
Quoting MuddBuddha
Disliked
check out the COT data...this may help you out. As long as the largest speculators are short the dollar, she aint goin nowhere.

Their decision whether to hold dollar longs or shorts and against which pair is based on much more than just the interest rate itself. It's a much bigger market than that.

Set the chart for any of the currency pairs and check out the long/short numbers on the bottom chart.

http://www.timingcharts.com/index.aspx
Ignored

Hey Mudd, let me get this clearer...I am attaching a chart of the E-Mini S&P 500 future...The chart is showing commercials long by 17,695, Large traders short by 184,458 and small speculators long by 166,763...

If I may ask, what do these numbers represent?? Does it mean that the net commercial positions are long 17,695 contracts??? Or what does it mean exactly???


Thanks,

Nader
Attached Image
 
 
  • Trading Discussion
  • /
  • Alright US interest rate 4.75%>>>5.00%? Should be strong for US dollar now?
  • Reply to Thread
    • Page 1 2
    • Page 1 2
0 traders viewing now
  • More
Top of Page
  • Facebook
  • Twitter
About FF
  • Mission
  • Products
  • User Guide
  • Media Kit
  • Blog
  • Contact
FF Products
  • Forums
  • Trades
  • Calendar
  • News
  • Market
  • Brokers
  • Trade Explorer
FF Website
  • Homepage
  • Search
  • Members
  • Report a Bug
Follow FF
  • Facebook
  • Twitter

FF Sister Sites:

  • Metals Mine
  • Energy EXCH
  • Crypto Craft

Forex Factory® is a brand of Fair Economy, Inc.

Terms of Service / ©2023