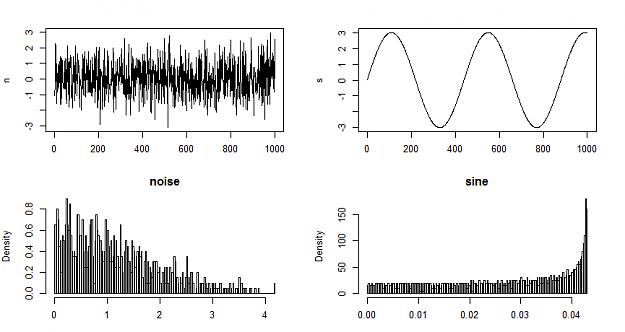
I would like to clarify that the 50%-50% is not the reason for the convergence in distribution to a Gaussian (Central Limit Theorem is). Even with a 70%-30% biased coin it would converge; except that the mean would not be zero. The time bars (like H1) also have 50-50% probability of next bar up or down yet the distribution of the N bar return never converges to a Gaussian.
There is no need for MC simulation with Gaussian you can calculate in closed form. This is what I meant by "[Gaussian] helps a lot with the math"
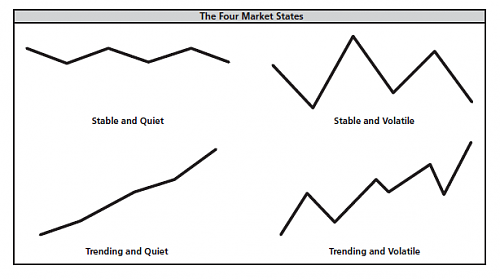
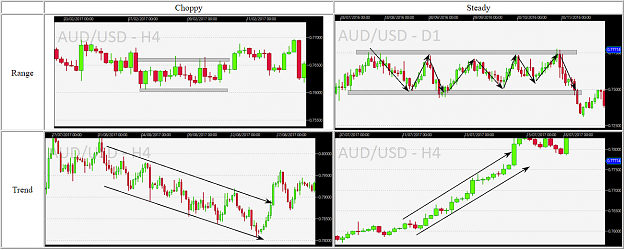
I'm afraid this will only classify between "ranging" and "trending". As I wrote above these are different concepts than "steadiness" vs "choppiness". But it is also true that the more chaotic the more the movement of the price will behave like a brownian motion (aka gaussian random walk). The RW is bad at visiting its space therefore if the price visits a lot of levels it is probably not choppy... Detrending the price and estimating a distribution with 7 samples only is impossible. Adal is right I'll have to sample at the tick to have a chance.
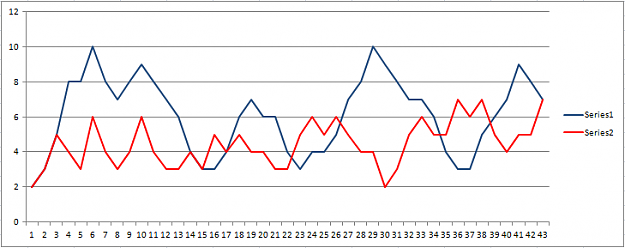
QuoteDislikedI think the best way to do it is using monte carlo simulation. This way you can see the probabilities of 7th bar in future (or any other bar number in future) hitting certain levels
QuoteDislikedIf the bars stay within 1 standard deviation (or any other threshold) of expected probabilities and swinging within minus and plus standard deviations you can call this choppy market phase. If it is above 1.96 standard deviation the market could be see as trending phase. Just an idea to get started..
No greed. No fear. Just maths.