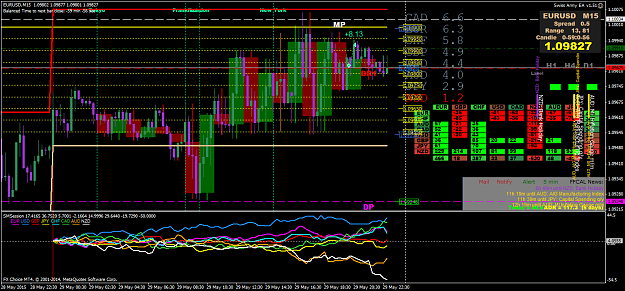
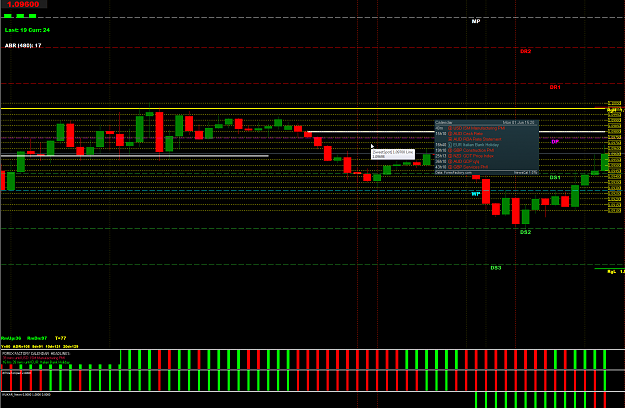
Disliked{quote} Thanks for posting all of these. I've given them a try, and the one that looks most appealing to me is the "StrengthMeter wSuffix-mod2." I've been wanting a histogram of the calculations that Giraia shows...this one has a histogram, but the calculations seem different than Giraia. Do you have any idea on how the calculations are being done? Also, why are there 3 different bar displays? Or do you know where this indi was originally posted? Perhaps the info would be there. {image}Ignored
The information on the left is the longer term strength, in the middle is the shorter term strength and on the right are the pairs the indicator suggests for trading. You can learn more about that specific indicator here from it's original creator.
I can't program in MQL so I won't look at the code... but looking at the indicator, the lines don't start from 0 so they shouldn't represent absolute values (like in some indicators). The lines should represent a relative strength, comparing current values with past values of a composite calculated with several pairs (7) for each currency.
Jaime
