• Home
  • Forums
  • Trades
  • News
  • Calendar
  • Market
  • Brokers
  • Login
  • Join
  • User/Email: Password:
  • 5:02am
Menu
  • Forums
  • Trades
  • News
  • Calendar
  • Market
  • Brokers
  • Login
  • Join
  • 5:02am
Sister Sites
  • Metals Mine
  • Energy EXCH
  • Crypto Craft

Options

Bookmark Thread

First Page First Unread Last Page Last Post

Print Thread

Similar Threads

building multi-pair multi-timeframe scanner 46 replies

Multi timeframe multi chart 13 replies

Timeframe inside current timeframe - is that possible? 2 replies

Seeing higher timeframe indicators on lower timeframe 4 replies

BUY run profit 1 lot, SELL LIMIT 2 LOT down again n BUY 1 lot - EA Reqd 5 replies

  • Trading Discussion
  • /
  • Reply to Thread
  • Subscribe
  • 279
Attachments: Multi-Lot Multi-Timeframe Position trading
Exit Attachments

Multi-Lot Multi-Timeframe Position trading

  • Last Post
  •  
  • 1 45Page 678 74
  • 1 5Page 67 74
  •  
  • Post #101
  • Quote
  • Edited Sep 4, 2014 1:58pm Sep 3, 2014 11:35pm | Edited Sep 4, 2014 1:58pm
  •  Graviton
  • Joined Apr 2010 | Status: Member | 1,096 Posts
Fair enough Proximus. Let's see if I can address your comments. Of course, every tick on the chart represents a valid trade. Each is just as valid as the other. Indeed, I often do look at the tick chart, but it doesn't give me much perspective, like how does this price compare to where it was a week ago, or a month ago. Of course you could get that information with a huge screen and a very compressed tick chart, but charts are designed to be informative to the eye, and it's much easier and cleaner for me to look at a daily chart to see where prices were a month ago than a highly compressed 1 minute chart. In the end, it's just compression of data. The 1 minute timeframe is merely a compression of all the ticks that occurred over that 1 minute time span, just as the 5M is the compression of the 5 previous 1Minute charts, and so on up through the daily and monthly charts. It is true that a 60 minute chart is very much like the summation of 60 1-minute charts, and a 60 minute moving average over a long period would look very similar. You can run many moving averages and pick out the data as you suggest, but it's a bit messy, as your chart above portrays. If it pleases my eye and makes it easier for me to see the data I am looking for, it has served it's purpose. If you prefer to look at a highly compressed 1 minute chart rather than an expanded 60 minute chart, that's fine with me. I sometimes do that myself to see more detail in price movement over the same time period.

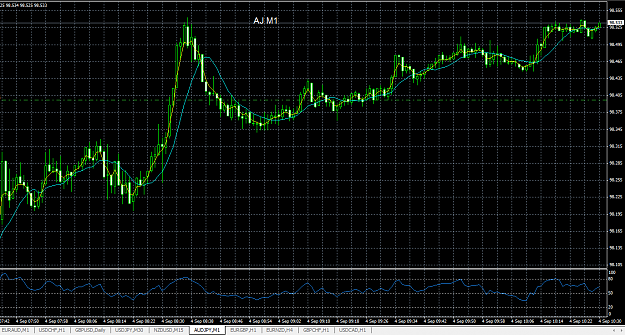
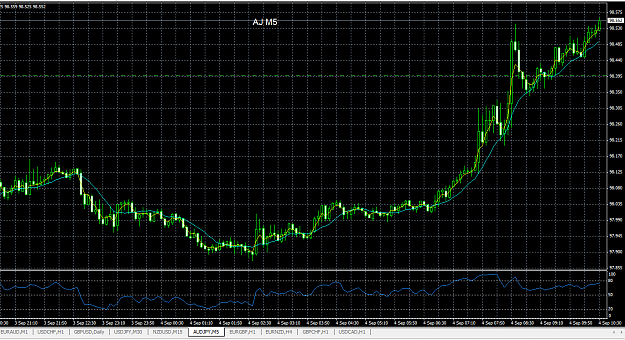
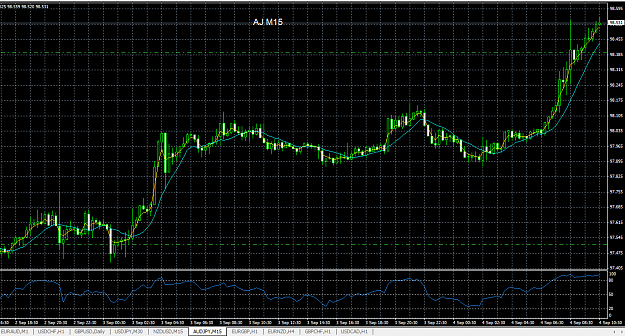
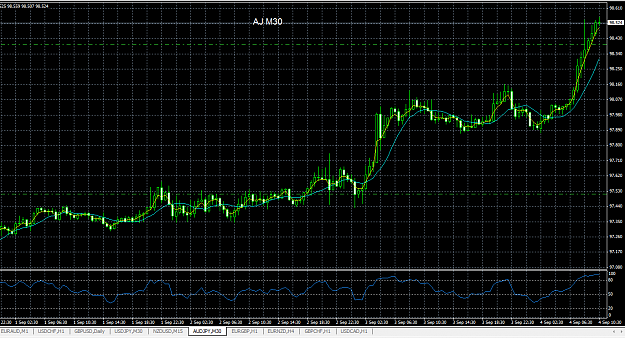
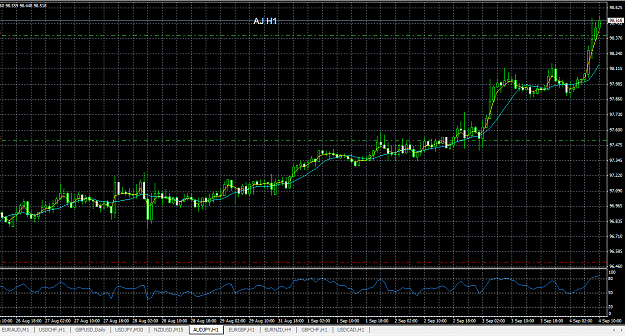
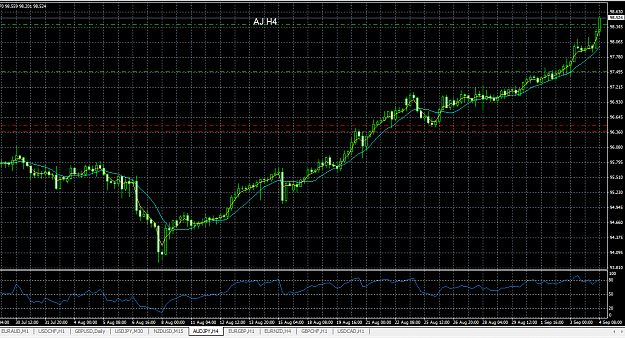
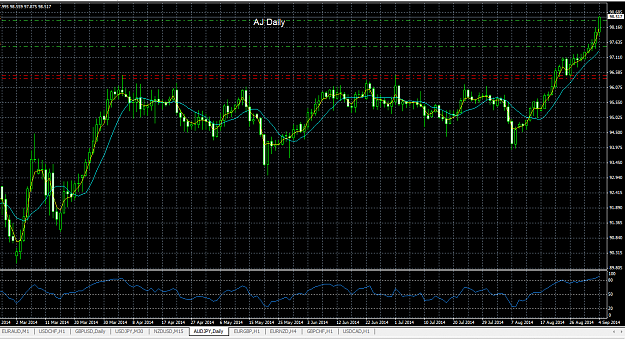
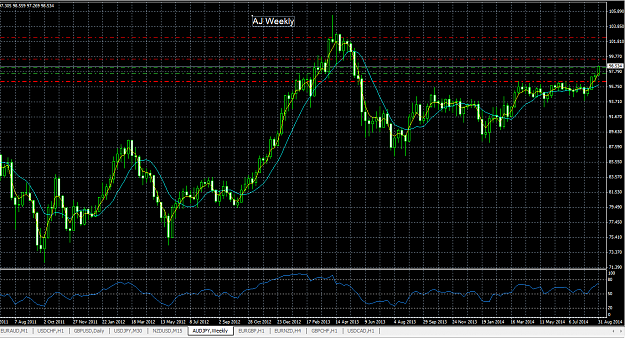
The logic of checking trends at different sampling periods is that they will give different results for the trend in different time periods. If you sample at only one time period, say the 1H chart, and trend is up, does that mean the trade is valid for a period of two weeks? But if the trend is up on the weekly chart, do you really want to enter long right now when price is going down on the 1 minute, 5 minute, 15M, 30M, H1, H4 and daily? You might be right as far as the weekly chart, but you might be entering in the middle of a big reversal and the only way to see it is to look at the lower timeframes. If all those charts are trending up though, I believe it would be safe to say that price is trending up. As far as the spacing of the timeframes, they are rather arbitrary, like they are all a factor of 4 to 6 apart, except the 30 minute chart that doesn't fit the 4 to 6 factor rule. Ignore it if you like. If you are a stickler for order, you can make them all a factor of 5 apart, though you will have some odd periods and I doubt it would improve your results any.

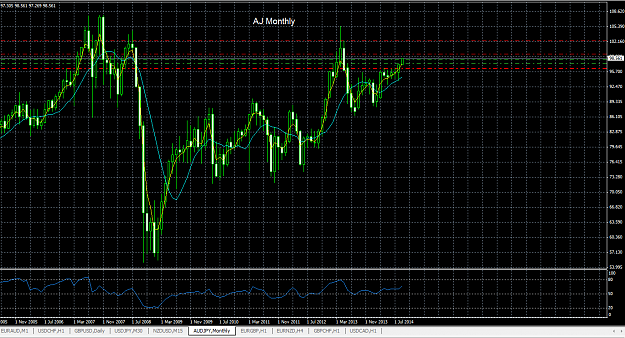
I have a chart with my favorite widgets on it, and another on another screen which is usually naked price, or almost so. I use 3 objective methods to determine trend on my widget chart. I suspect each trader will find her or his own favorites. Mine are a 100 period quadratic regression, a 5ema cross over the 10sma, and the 10RSI(H+L)/2 cross over the 50% mark. If a trend is strong and clear, these will usually all agree. Occasionally I will refer to moving averages or 5,3,3 stoch as well, but those aren't deciding factors for me. Usually, I can tell at a glance of a naked chart if trend is up or down, but as you noted, I need something objective to be consistent. If a trend isn't very clear to me, I consider it undecided and I don't count it in my analysis. If I have to blow the chart way up or squint to see the trend, I skip it and move on. I'm sure I've thrown out some very good trades because trend wasn't clear to me at that moment, but that's the price of consistency. Happy trading!
 
 
  • Post #102
  • Quote
  • Sep 4, 2014 10:09am Sep 4, 2014 10:09am
  •  Graviton
  • Joined Apr 2010 | Status: Member | 1,096 Posts
Good morning traders. I took some large profits off EA and EU shorts this morning and put some new lots on to work on them. If you read my previous wordy posts you saw the case I made for shorting those pairs. I suppose It would have been simpler to just say, short EU and EA, but I can't work that way. I'm not a signal service. If you missed this big move, not to worry, there will be very many more, even on this pair. I show the next EU support at 1.2750 and I have no good reason to believe it wont eventually make it to there, but of course, that could change with market conditions.

Proximus asked a few good questions in his previous post. I tried to answer them all but if something isn't clear, I'll go into it in more detail or post some chart examples. From a technical analysis point of view, the reason to check trends across multiple timeframes is to extract all the information that price action has to offer. To simply analyze a single timeframe, or the one you intend to trade and only the one above and below it seems like a waste of valuable information. Why not use all the information that price movements have to offer? Of course my method isn't the only way to extract all that information, but it's simple and works well. The Fundamental confirmation of the technical trend is a critical factor though. In my own humble opinion, if I can't find a really good fundamental reason for trading a pair in a certain direction, then I probably don't know enough about it to be trading it. In that case, it's time to go back to the news feeds and see if I can't find a good fundamental reason for the trend. Right now, AJ is trending up. I wonder why?

I've said about all I can on trends for the moment. If anyone has any questions or comments, I'll try to respond.
 
 
  • Post #103
  • Quote
  • Edited at 11:46am Sep 4, 2014 10:43am | Edited at 11:46am
  •  Graviton
  • Joined Apr 2010 | Status: Member | 1,096 Posts
Let's look at a few charts, just for fun. I'll look at the AJ long I just mentioned from a technical perspective first. I like to keep technical analysis as simple as possible. I'll plot charts with just two indicators for reference, but you can see that for the most part, the trends are obvious. I'll start with the M1 and go all the way through the Monthly. In practice, this just takes me a few minutes, but it's quite the chore to do it here.

First, The AJ M1. It's obvious the trend is up on this one. The 10 period RSI calculated on the median price, (H+L)/2, confirms this as it is above the 50% line. The 3ema (yellow) cross over the 10sma (aqua) is all over the place on the M1 chart and not helpful. We'll call this a clear uptrend. If anyone disagrees with my analysis, shout out!

Attached Image (click to enlarge)
Click to Enlarge

Name: AJ M1.PNG
Size: 62 KB
 
 
  • Post #104
  • Quote
  • Edited at 4:02pm Sep 4, 2014 11:04am | Edited at 4:02pm
  •  Graviton
  • Joined Apr 2010 | Status: Member | 1,096 Posts
The AJ M5 is much the same, an obvious uptrend. This is still a little short for trades designed to run for weeks or months, but it's good entry information. Why enter when price is moving against you on the short timeframes? Better to wait until it hits a bottom and then enter after it turns in your direction, I'd think:

Attached Image (click to enlarge)
Click to Enlarge

Name: AJ M5.PNG
Size: 57 KB
 
 
  • Post #105
  • Quote
  • Sep 4, 2014 11:07am Sep 4, 2014 11:07am
  •  Graviton
  • Joined Apr 2010 | Status: Member | 1,096 Posts
I like the M15 for short timeframe indication. I always want the M15 confirmed in my direction for entry. Here, the RSI and the 3emaX10sma both confirm my visual call that this pair is in an uptrend:

Attached Image (click to enlarge)
Click to Enlarge

Name: AJ M15.PNG
Size: 57 KB
 
 
  • Post #106
  • Quote
  • Sep 4, 2014 11:09am Sep 4, 2014 11:09am
  •  Graviton
  • Joined Apr 2010 | Status: Member | 1,096 Posts
AJ M30 is confirmed to be in an uptrend, even if you don't like this timeframe, it is:

Attached Image (click to enlarge)
Click to Enlarge

Name: AJ M30.PNG
Size: 55 KB
 
 
  • Post #107
  • Quote
  • Sep 4, 2014 11:10am Sep 4, 2014 11:10am
  •  Graviton
  • Joined Apr 2010 | Status: Member | 1,096 Posts
AJ H1 is confirmed to be in an uptrend:

Attached Image (click to enlarge)
Click to Enlarge

Name: AJ H1.PNG
Size: 54 KB
 
 
  • Post #108
  • Quote
  • Sep 4, 2014 11:12am Sep 4, 2014 11:12am
  •  Graviton
  • Joined Apr 2010 | Status: Member | 1,096 Posts
AJ H4 is confirmed to be in an uptrend:

Attached Image (click to enlarge)
Click to Enlarge

Name: AJ H4.PNG
Size: 56 KB
 
 
  • Post #109
  • Quote
  • Sep 4, 2014 11:13am Sep 4, 2014 11:13am
  •  Graviton
  • Joined Apr 2010 | Status: Member | 1,096 Posts
AJ Daily is confirmed to be in an uptrend:

Attached Image (click to enlarge)
Click to Enlarge

Name: AJ Daily.PNG
Size: 65 KB
 
 
  • Post #110
  • Quote
  • Edited at 2:48pm Sep 4, 2014 11:14am | Edited at 2:48pm
  •  Graviton
  • Joined Apr 2010 | Status: Member | 1,096 Posts
AJ Weekly is confirmed to be in an uptrend though it's a bit messy and the RSI and MA crossovers help to confirm the trend direction:

Attached Image (click to enlarge)
Click to Enlarge

Name: AJ Weekly.PNG
Size: 70 KB
 
 
  • Post #111
  • Quote
  • Edited at 11:50am Sep 4, 2014 11:15am | Edited at 11:50am
  •  Graviton
  • Joined Apr 2010 | Status: Member | 1,096 Posts
Finally, AJ Monthly is confirmed to be in an uptrend. The others were obvious at first glance. This one is a little more messy than the others, so the indicators help me with confirmation here. :

Attached Image (click to enlarge)
Click to Enlarge

Name: AJ Monthly.PNG
Size: 68 KB
 
 
  • Post #112
  • Quote
  • Sep 4, 2014 11:22am Sep 4, 2014 11:22am
  •  Graviton
  • Joined Apr 2010 | Status: Member | 1,096 Posts
So what does all this mean? A lot really. It means price is moving in a strong uptrend across multiple timeframes. It means that short timeframes jump around a lot, but if you are just patient and wait a bit they will line up in your direction if it's a good trade, and if it isn't you don't want to take it anyway. It means that you need to look at medium timeframes (M30, H1, H4) to make a good entry for a longer timeframe trade. It means if you want to trade longer timeframes, the longer timeframes (Daily, weekly and monthly) should be moving in your direction. It DOES NOT mean this is a good trade. It only means it might be. You still need Fundamental Confirmation to select it as a good trade. You can see, I've already done my homework, selected it and placed the first two lots on it. The first is now up about +100 pips. I can take it as profit and put a new one on anytime I like for just the cost of the spread. I can run 3 lots, but that's just being greedy. Lets not be greedy.
 
 
  • Post #113
  • Quote
  • Edited at 12:18pm Sep 4, 2014 11:45am | Edited at 12:18pm
  •  Graviton
  • Joined Apr 2010 | Status: Member | 1,096 Posts
I'll help a little, but you can do this easily. Look at the DailyFX Economic calander. Aussie GDP is up. The trade balance is better also (as signified by the green number). This stuff is really easier than most people would like you to believe. The Japanese government and BOJ are trying to fight deflation by inflating the Yen. It was in the headlines in all the financial press. You don't read the financial press? And you want to get rich trading currencies? Hmmmm. So, anyway, strong Aussie, weak Yen. Fundamental confirmation. All that's left is to make a good entry and cut your losses short if you are wrong. You will be wrong sometimes. I can promise that. I can't say when. You can't either or you wouldn't be wrong in the first place. But if you enter a trade and it goes bad and then goes from bad to worse, you were wrong somehow, since that wasn't what you intended at all. It's ok to run wide stops to keep from getting shaken out of a good trade, but CUT YOUR LOSSES SHORT! I can't tell you exactly when or by how much, that's a decision you have to make, but work on cutting your losses short, every day, every trade, for the rest of your life. Sometimes you'll do better at it than others, but if you don't even try you'll stink at it. That's all I have to say about that.

Questions? Comments?
 
 
  • Post #114
  • Quote
  • Sep 4, 2014 1:13pm Sep 4, 2014 1:13pm
  •  Graviton
  • Joined Apr 2010 | Status: Member | 1,096 Posts
If there are no comments, I'll just ramble on. So why trade trends? Well, you have the options of ranges, trends or reversals. Ranges are just trends on a shorter timeframe. So trading from support to resistance on a weekly chart is just like trading a 2 month long trend on an H4 chart. There's really no difference there except that you are incorporating s/r's in your trading for your stop and TP. That's fine. Traders aren't blind. They can all see the s/r's and shoot for them. It can be like a form of trading with the heard instinct. You have to be quick before a reversal eats up your profits, but if it's a daily or weekly range, not really that quick compared to someone trading short timeframes. If it works for you, go for it, but do consider trading ranges on longer timeframes so unexpected news doesn't give you a heart attack.

Trading reversals is much trickier. On a daily chart there might be 200 candles, maybe less if you like to blow them up to the size of my hand. But consider that to successfully pick a top or bottom for a reversal, you have to pick the one candle out of 200 that represents the reversal. You may be very good at it and make a fortune doing it, but I shudder at the thought of those odds, 1 out of 200. In the end though, even if you are trading reversals, you are still trading the trends, you are just trying to pick the ends of the trends rather than the big fat middle as I do.

Since I trade multiple lots, I need large price movements of 100 or 200 or more pips over a longer period of time to get my trades on and off. Larger moves over a longer period of time is better for me. If a trade doesn't go my way soon, I'll exit the first single lot for a small loss. If it does, I add to it, but I need a long running trend to manage my trades. That sort of wraps up my discussion on trends for the moment unless someone has a question or comment on it. Next I'll discuss trading multiple lots a bit more, or pyramiding, or scaling in, or what ever term you prefer to use.
 
 
  • Post #115
  • Quote
  • Sep 4, 2014 2:05pm Sep 4, 2014 2:05pm
  •  Graviton
  • Joined Apr 2010 | Status: Member | 1,096 Posts
Just one edit to make a correction. I just realized I plotted a 3ema cross over the 10sma on the above charts. That's because it was plotted on top of what is normally my "Naked" chart to display here and I made a mistake with that. I normally use a 5ema cross over the 10 sma on my widget chart for confirmation of trend direction. I think if you use that instead you'll get much more consistent results. Of course, if you prefer to trade naked, it doesn't matter.
 
 
  • Post #116
  • Quote
  • Sep 4, 2014 3:44pm Sep 4, 2014 3:44pm
  •  msmarple
  • Joined Oct 2008 | Status: Just be the witness. | 1,089 Posts
Thank you for the thread, a long time since I have been reading about MTF and Trend in this professional manner, it reminds me a bit of the Equity Millipede thread. I`ll continue reading if you don`t mind, and in case of questions or ideas I would be happy to support.

My best wishes to your success.

M
Be like water.
 
 
  • Post #117
  • Quote
  • Sep 4, 2014 3:58pm Sep 4, 2014 3:58pm
  •  Graviton
  • Joined Apr 2010 | Status: Member | 1,096 Posts
Welcome aboard Msmarple. Thanks for the kind words. Any comments or suggestions you might have are appreciated.
 
 
  • Post #118
  • Quote
  • Sep 4, 2014 4:27pm Sep 4, 2014 4:27pm
  •  Graviton
  • Joined Apr 2010 | Status: Member | 1,096 Posts
Lots of data out on the DailyFX calendar today. Mostly bad for the Euro. Mostly good for the USD. This would have caused a crash in the Euro had The ECB not preempted it by announcing QE earlier. They didn't have much choice. They either had to stand by and watch the Euro crash and do nothing, or do something and watch it crash as a result of their effort to avoid deflation and recession. Either way it was coming down so they did the right thing to distribute some Euros around and stimulate growth.
 
 
  • Post #119
  • Quote
  • Sep 4, 2014 4:38pm Sep 4, 2014 4:38pm
  •  Proximus
  • Joined Oct 2013 | Status: Forex Shaman | 1,468 Posts
Quoting Graviton
Disliked
Fair enough Proximus. Let's see if I can address your comments. Of course, every tick on the chart represents a valid trade. Each is just as valid as the other. Indeed, I often do look at the tick chart, but it doesn't give me much perspective, like how does this price compare to where it was a week ago, or a month ago. Of course you could get that information with a huge screen and a very compressed tick chart, but charts are designed to be informative to the eye, and it's much easier and cleaner for me to look at a daily chart to see where prices...
Ignored
I suppose there are logical timeframes which have a reason behind them like :

  1. 1 Month (because banks pay monthly taxes and rebalance their inventory at the end of the month)
  2. 1 Week (5 days) (because the FX market is liquid only in working days, and less liquid in weekend)
  3. 1 Day (because the swaps at the end of the day segment the price)

But timeframes like M5,M15,H1,H4 are really a nonsense to me as if there were something magical which separates one group of 15 minutes from athother.


I understand that candles look nice and simple on the chart, but they have no intrinsic logic behind them.

Also i respect that you have a particular strategy and if its profitable the better, but still i dont see how X method is better than Y.

It may be that your method is not the most efficient one out there, but if it makes money its fair enough, but if its not the most efficient then it is prone to errors and losing streaks in the future probably.I dont think you never wondered if there is any method to improve your strategy somehow to make it more efficient.

And if you did then you also had to think about a real objective method to objectify trends, because X technical traders will give X+1 definitions to what a trend is, and its impossible to find consistency with so many subjective views out there, and hardly any profits.

I will follow your thread because its interesting, but i`m just no into subjective trading, it hurts the equity curve

"There's a sucker born every minute" - P.T. Barnum
 
 
  • Post #120
  • Quote
  • Sep 4, 2014 4:59pm Sep 4, 2014 4:59pm
  •  Graviton
  • Joined Apr 2010 | Status: Member | 1,096 Posts
Quoting Proximus
Disliked
{quote} I dont think you never wondered if there is any method to improve your strategy somehow to make it more efficient. And if you did then you also had to think about a real objective method to objectify trends, because X technical traders will give X+1 definitions to what a trend is, and its impossible to find consistency with so many subjective views out there, and hardly any profits. I will follow your thread because its interesting, but i`m just no into subjective trading, it hurts the equity curve
Ignored
I've been trying to simplify, objectify and improve my method for quite a while now. What could be a more objective trend criteria than the 5ema crosses above the 10sma and the RSI goes above 50% for an uptrend? Of course, most trends are very obvious when I look at the chart, but I still require confirmation by my objective criteria. It's the only way I can stay out of the tall grass doing this. Of course, there are still some subjective elements involved, like where to cut losses short. I've never seen a completely objective trading system that worked for very long. I'm sure if there was such a thing, someone would code it into a computer and become the worlds first trillionaire. Generally, I agree with your concerns over subjective methods. They may work for some, but they never did for me. But if you or anyone else sees a way to improve this method, I'd be grateful for the suggestions.

As far as the default timeframes on MT4, there are scripts that allow you to change those if you like.
 
 
  • Trading Discussion
  • /
  • Multi-Lot Multi-Timeframe Position trading
  • Reply to Thread
    • 1 45Page 678 74
    • 1 5Page 67 74
0 traders viewing now
  • More
Top of Page
Forex Factory Blog Updated: Alerting All Members
  • Facebook
  • Twitter
About FF
  • Mission
  • Products
  • User Guide
  • Media Kit
  • Blog
  • Contact
FF Products
  • Forums
  • Trades
  • Calendar
  • News
  • Market
  • Brokers
  • Trade Explorer
FF Website
  • Homepage
  • Search
  • Members
  • Report a Bug
Follow FF
  • Facebook
  • Twitter

FF Sister Sites:

  • Metals Mine
  • Energy EXCH
  • Crypto Craft

Forex Factory® is a brand of Fair Economy, Inc.

Terms of Service / ©2022